
Most restaurants don't have a sales problem. They have a control problem.
You're busy, covers are moving, the POS looks healthy, and somehow profit still feels tight. That usually means your food cost percentage calculation is either wrong, outdated, or ignored until month-end, when it's too late to fix anything.
If you don't know your real food cost, you're pricing blind. You can't tell which dishes earn their space, which ones drain margin, or whether rising costs come from supplier pricing, waste, over-portioning, or poor menu mix. This number isn't back-office admin. It's one of the clearest signals of whether your menu is working or your kitchen is leaking cash.
Table of Contents
- Why Food Cost Percentage Is Your Most Important Number
- Two Core Methods for Food Cost Percentage Calculation
- What a Good Food Cost Percentage Looks Like
- Common Mistakes That Inflate Your Food Costs
- Actionable Tactics to Lower Your Food Cost Percentage
- Track and Optimize with Real-Time Menu Analytics
Why Food Cost Percentage Is Your Most Important Number
Food cost tells you whether your sales are creating profit or just creating work.
A restaurant can look busy and still lose margin every shift. When ingredient costs climb, portions drift, or the wrong items dominate sales, your top line can hold steady while your bottom line gets weaker. Owners usually spot this late because they watch revenue first and cost discipline second.
That's a mistake.
Food cost percentage is the operating number that connects your kitchen, your menu, your pricing, and your purchasing. If it's off, every decision built on it gets worse. You underprice dishes, keep weak sellers too long, miss waste patterns, and blame slow profit on everything except the menu.
Why it matters in daily operations
- Pricing gets sharper: You stop guessing what a dish should sell for.
- Menu decisions improve: You can separate popular items from profitable ones.
- Kitchen discipline gets easier: Portion control and prep standards stop feeling optional.
- Purchasing gets cleaner: You see whether increased spend comes from volume, price, or poor ordering.
Practical rule: If you only review food cost after the month closes, you're managing history, not profit.
This also gives your management team a common language. Chef, GM, and owner can all look at one number and ask the right question: what changed?
If you want a broader view of the operating numbers that matter most, this breakdown of restaurant KPIs that actually drive decisions is worth keeping close.
What happens when you ignore it
Operators who don't track food cost tightly usually run into the same pattern:
- Sales look solid
- Prime costs feel heavier
- Menu prices lag behind ingredient reality
- Low-margin items sell well and create false confidence
- The team works harder without seeing better profit
That's why this number matters more than most owners admit. It's not just a percentage on a spreadsheet. It's a management tool. Use it weekly, and it starts telling you where profit is slipping before the P&L does.
Two Core Methods for Food Cost Percentage Calculation
A weekly inventory count says one thing. A recipe card says another. That gap is where margin leaks hide.
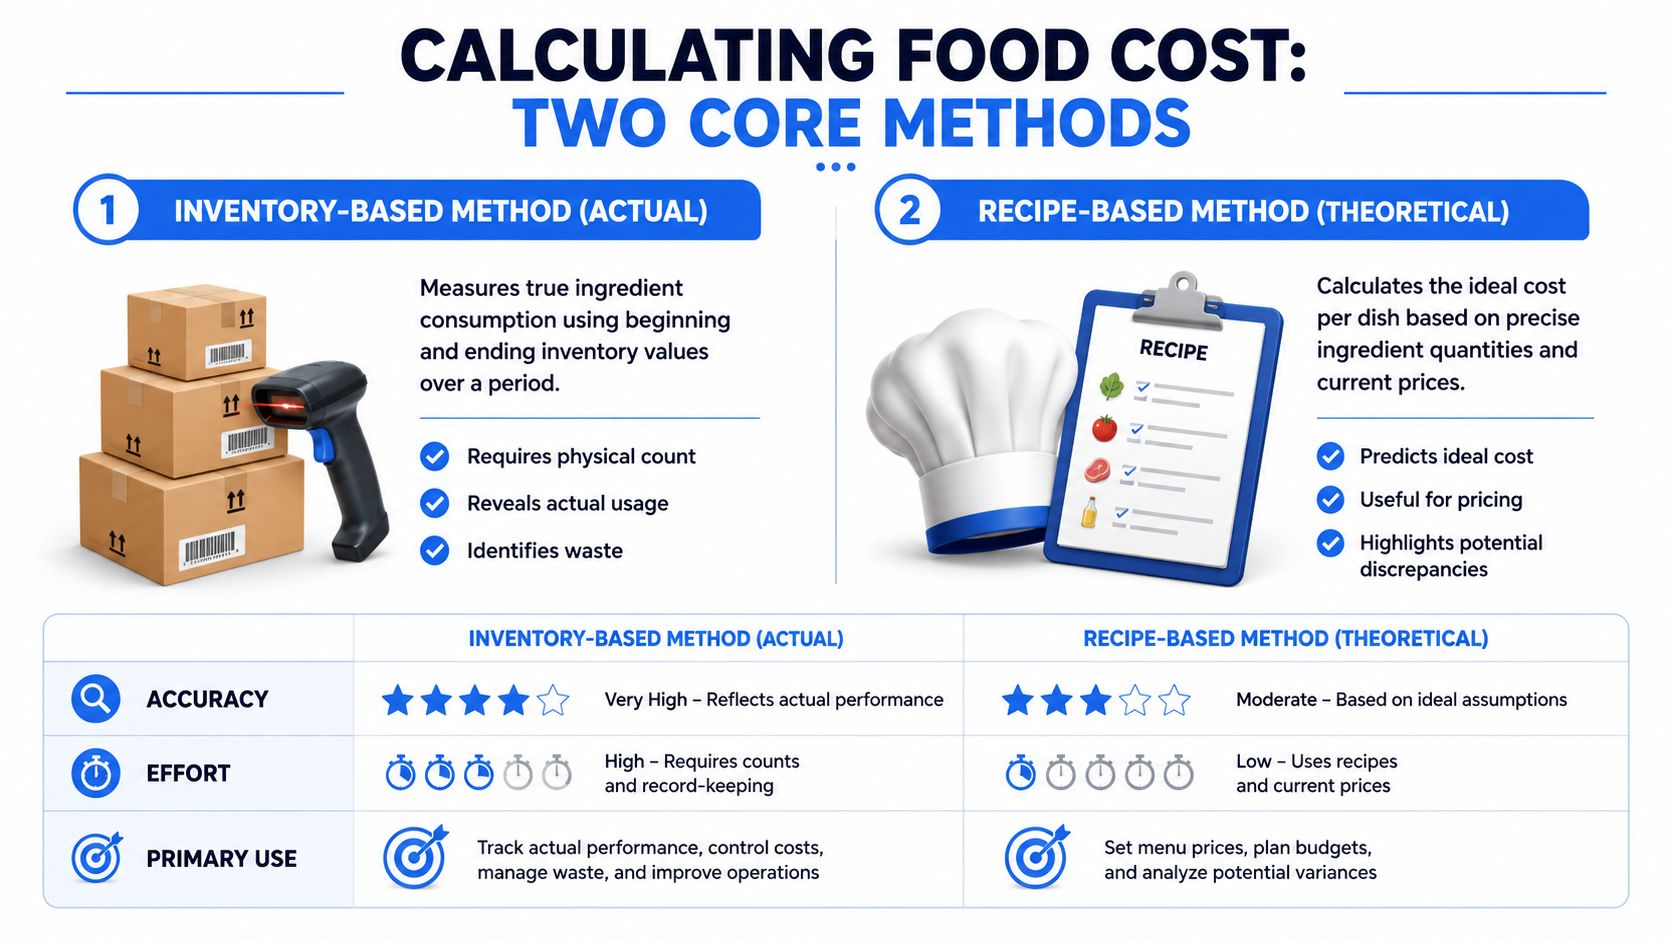
You need two food cost calculations because they answer two different management questions:
- Actual food cost: What did the kitchen really consume over a period?
- Ideal food cost: What should each dish cost if the team follows the recipe and portions correctly?
Serious operators track both. One measures control. The other drives pricing, menu decisions, and daily correction before a bad month lands on your desk.
Use actual food cost to measure operating reality
The inventory-based method shows what happened in the actual business, with all the mess that comes with it: waste, over-portioning, bad ordering, missed invoices, and inconsistent counts.
US Foods' guide to tracking food cost percentage outlines the standard process:
- Record beginning inventory.
- Add food purchases for the period.
- count ending inventory.
- Calculate COGS = Beginning Inventory + Purchases – Ending Inventory.
- Divide COGS by food sales.
- Multiply by 100.
That formula is simple. Execution is where owners lose money.
Use these rules every time:
- Count on the same day and time each week
- Use consistent units across all items
- Exclude paper goods, chemicals, and other non-food items
- Close out invoices before finalizing purchases
- Assign one trained person to own the process
- Review unusual swings immediately, not at month-end
A simple weekly example makes the point. Start with beginning inventory, add the week's purchases, subtract ending inventory, and divide that result by food sales for the same week. That gives you actual food cost percentage for the period.
If your inventory method is sloppy, your reporting will be sloppy too. Your restaurant P&L should reflect what the operation actually consumed, not a rough guess patched together after the month closes.
Use ideal food cost to price dishes and manage the menu
Actual food cost is backward-looking. Ideal food cost is a decision tool.
You calculate it plate by plate. Add the cost of every ingredient in one serving, divide by the menu price, then multiply by 100. LLBG's explanation of per-dish food cost uses this formula: (Total Cost of Dish Per Serving / Menu Price of Dish) × 100.
This method matters because a restaurant does not lose margin evenly. Margin disappears dish by dish.
For a pasta plate, cost the exact serving amount of:
- pasta
- oil
- sauce
- protein
- cheese
- garnish
Then compare that ingredient total to the selling price.
Do not use rough averages. They hide underpriced menu items, especially the popular ones. A dish can sell well and still hurt profit every time it leaves the pass.
Here's what ideal costing helps you catch fast:
- A best-seller with a weak margin
- A recipe change that never made it into pricing
- Portion sizes that grew over time
- Add-ons and garnishes that look minor but stack up
- Menu categories that need a price increase or redesign
When to use each method
| Method | Best use | What it reveals |
|---|---|---|
| Inventory-based actual cost | Weekly or monthly control | Real consumption, waste, purchasing accuracy, count discipline |
| Recipe-based ideal cost | Pricing, menu engineering, recipe management | Whether each dish is priced correctly and worth keeping |
Use actual cost to control the operation you just ran.
Use ideal cost to build a menu that holds margin every day.
The payoff comes from comparing them. If ideal costs look fine but actual costs keep climbing, the problem is rarely the spreadsheet. It is usually portioning, waste, receiving, prep discipline, or product mix. That is why this calculation is more than math. It is a daily profit tool, and modern menu analytics make it much easier to spot which items are carrying the menu and which ones are dragging it down.
What a Good Food Cost Percentage Looks Like
Most operators ask the wrong question. They ask, “What's the perfect food cost?”
There isn't one universal number. There is a workable range, and then there's your concept, your menu, and your execution quality.
Benchmarks matter but context matters more
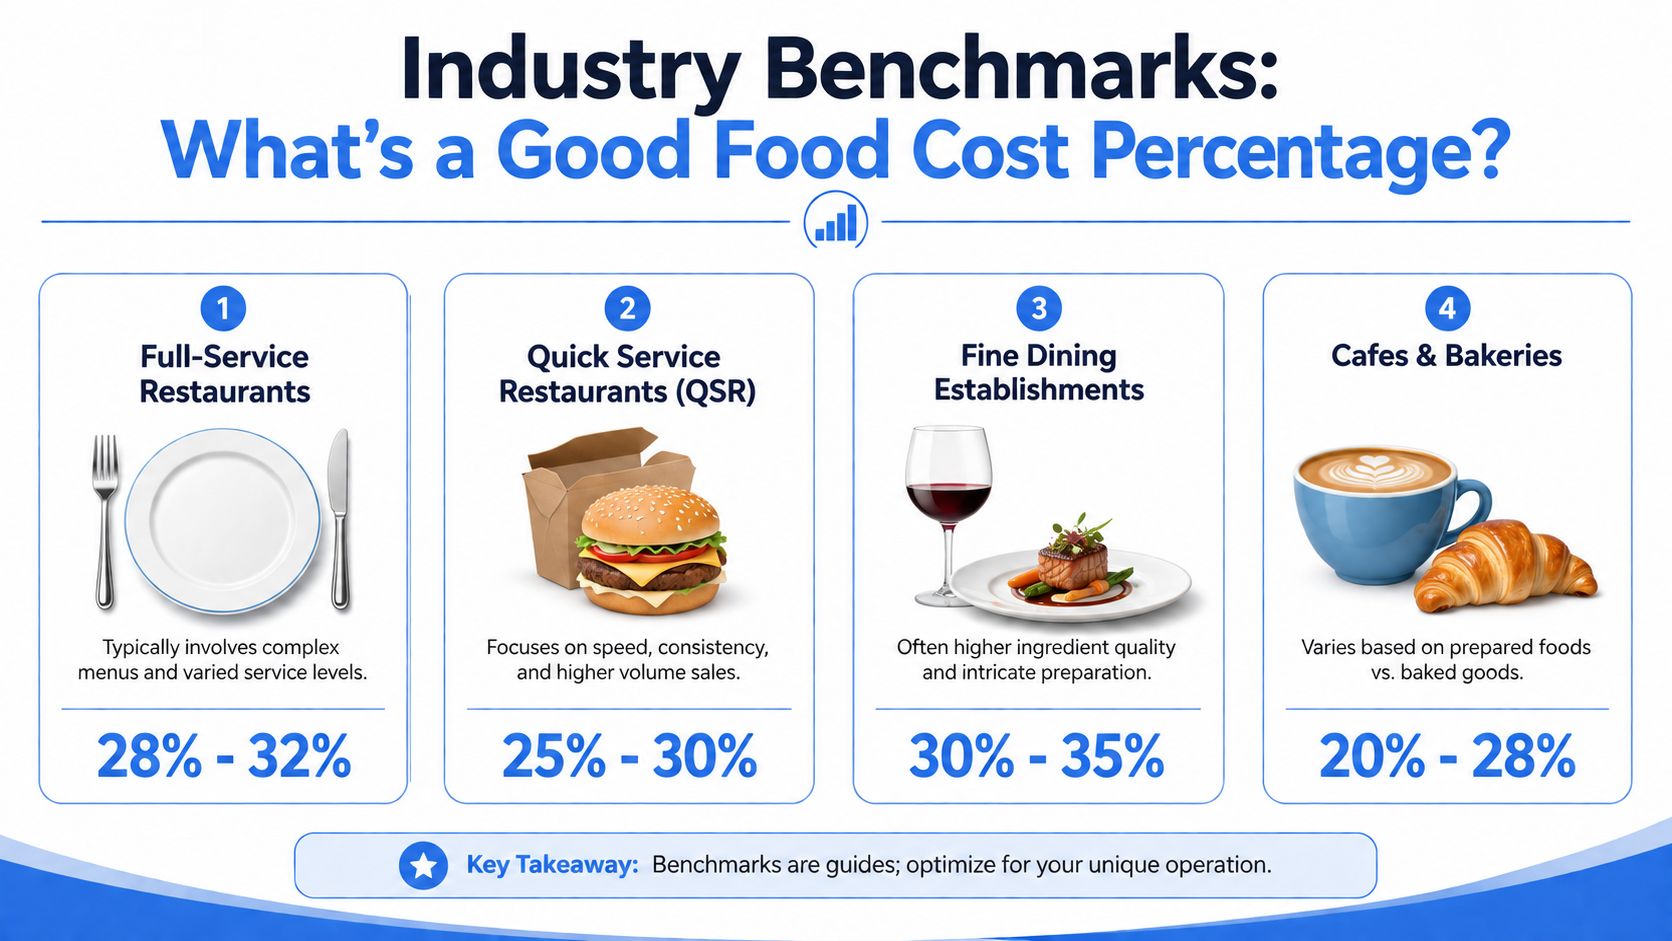
Industry benchmark data indicates that full-service restaurants typically target 25% to 35% food cost percentage, and ideal food cost per dish often targets 28–30%, while actual food cost averages 3–7% higher because of waste, theft, and over-portioning, according to this industry benchmark discussion.
That range matters, but don't use it as an excuse to stay vague.
A premium steak-driven menu won't behave like a café with strong beverage sales. A bakery with high-margin drinks and lower-cost baked items won't read like a full-service dinner house. Benchmarks are useful as guardrails, not as a substitute for knowing your own numbers.
The real issue is the gap
The biggest insight isn't your ideal number or your actual number by itself. It's the gap between them.
If your dish costing says one thing and your inventory says another, your operation is telling on itself. The issue usually sits somewhere in day-to-day execution:
- Portion drift during busy service
- Prep waste nobody logs
- Spoilage from weak ordering habits
- Untracked staff meals or comps
- Theft or invoice slippage
- Menu items built on old supplier pricing
Benchmarks are useful. Variance is actionable.
That's the number I care about most when I review an operation. A clean variance tells me the team follows standards. A messy one tells me the menu file and the kitchen reality don't match.
A smarter way to judge your number
Use this decision lens instead of chasing one magic target:
- In range and stable: good, but still test dish-level profitability.
- In range but drifting upward: investigate before it becomes a pricing issue.
- Above range with strong sales: likely a menu mix or portion problem.
- Below range but guest value feels weak: quality or pricing strategy may be out of balance.
A “good” food cost percentage supports profit without damaging guest experience. That's the balance. Not the benchmark by itself.
Common Mistakes That Inflate Your Food Costs
Friday night is packed, tickets are flying, and the kitchen is pushing plates fast. By Monday, sales looked strong, but food cost jumped again. That usually means one thing. The operation is leaking margin during execution.
Food cost problems rarely start in the formula. They start in the daily habits behind it. Bad counts, loose portions, missing waste logs, stale recipe costs, and sloppy tracking turn a clean calculation into a useless number.
The fix is not more theory. The fix is tighter control where product moves.
Where operators lose margin
These mistakes show up in profitable-looking restaurants all the time:
- Portions are not standardized: Recipe cards say 6 ounces. The line serves 7 or 8 when the rush hits. That extra ounce on a high-volume protein wrecks margin.
- Recipe costing ignores prep yield: You buy a case weight. You serve trimmed yield. If your costing file uses purchase weight instead of usable product, the dish looks better on paper than it performs in service.
- Waste is treated like a mystery: Burned items, over-prep, spoilage, dropped pans, and bad storage habits all count. If nobody records them, managers blame pricing when the issue is control.
- Ingredient costs sit unchanged for too long: Vendor pricing moves. If your recipe file stays frozen, menu profitability becomes fiction.
- Inventory counts are inconsistent: Different people count differently, units do not match invoices, and partial cases get guessed. That makes weekly food cost noisy and hard to trust.
- Comps, remakes, and staff meals disappear into the void: Product left the kitchen. If it is not categorized properly, your reporting loses the plot.
- Food and non-food purchases get mixed together: Cleaning supplies, paper goods, and smallwares do not belong in food cost. Put them in the wrong bucket and you will chase the wrong fix.
One bad habit is manageable. Four at once will bury your margin.
If the kitchen does not follow the recipe, the food cost percentage is wrong before you open the report.
What to fix first
Do not try to rebuild the whole operation in a week. Start with the controls that affect the most sales and the most expensive ingredients.
- Audit your top 10 sellers: Weigh portions, check plating, and compare actual build against the recipe card.
- Re-cost your volatile ingredients: Proteins, oils, dairy, and imported items should be updated first because price swings hit fastest.
- Clean up inventory units: Count in the same unit you buy, store, and use. Cases, pounds, quarts, and eaches must line up.
- Log every waste event: Product, quantity, reason, station, shift. Keep it simple so the team uses it.
- Track non-sale food separately: Staff meals, comps, remakes, and voids need their own codes every single day.
- Review dish-level performance, not just total food cost: A blended food cost can hide one menu item that is draining profit while another carries it.
That last point matters more than owners think. A restaurant can post an acceptable overall food cost and still lose money on its busiest items. Modern menu analytics help you catch that faster by showing which dishes sell well, which ones produce margin, and which ones only create the illusion of profitability.
Control the process, then trust the percentage. That is how you turn food cost from a monthly math exercise into a daily profit tool.
Actionable Tactics to Lower Your Food Cost Percentage
Lowering food cost doesn't mean buying worse ingredients. That's lazy thinking, and guests notice.
The better move is to protect margin through pricing discipline, menu design, tighter execution, and smarter ordering flow. That approach improves both profit and customer experience.
Fix pricing before you cut quality
The industry-standard target for ideal food cost percentage is 30%, and if a dish has a raw ingredient cost of $3.50, it should be priced at $11.67 to hit that target, based on the calculation shown in TouchBistro's food cost pricing guide.
That example matters because it forces a hard decision. If the market won't support the right price, don't pretend the dish works as-is. Change the portion, reformulate it, bundle it better, or remove it.
Margin moves that actually work
- Reprice with intent: Small menu updates matter when they're based on real ingredient cost, not guesswork.
- Push your high-profit items harder: Placement, naming, and photography all influence what guests choose.
- Stop protecting weak sellers: If an item is hard to execute, ties up prep, and doesn't deliver margin, it shouldn't survive on sentiment.
- Use bundles smartly: A well-built combo can raise average order value and improve the overall ratio without making the guest feel upsold.
Use menu design and ordering flow to lift margin
In this instance, modern menu psychology helps.
A static menu leaves upselling to chance and staff confidence. A digital ordering flow can guide better choices automatically:
- add-ons shown at the right moment
- meal deals that improve item mix
- modifiers that make premium upgrades easier
- featured items placed where guests notice them
That doesn't just help sales. It can improve your food cost percentage because the denominator improves when average order value rises.
Here's a practical walkthrough on how operators are using menu tools and ordering flow to tighten performance:
Operational fixes that protect the number
A strong menu still fails if the kitchen is loose.
- Negotiate, don't just accept: Talk to suppliers about alternatives, pack sizes, and substitute products that won't hurt the guest experience.
- Plan prep from sales reality: Don't prep by habit. Prep by likely demand.
- Use QR menus to shift mix: Feature items you want to sell more of, not just what has always sat on page one.
- Reduce staff workload through better systems: When ordering is clearer and menus are easier to update, your team spends less time explaining and correcting.
Owner advice: Your best margin improvement often comes from a better menu mix, not a cheaper ingredient.
Track and Optimize with Real-Time Menu Analytics
Food cost control isn't a one-time exercise. It's a daily operating habit.
The old approach was simple. Count stock, update a spreadsheet, review the damage later. That's too slow if your menu changes often, supplier prices move, or guest behavior shifts by daypart, weather, or promotion.
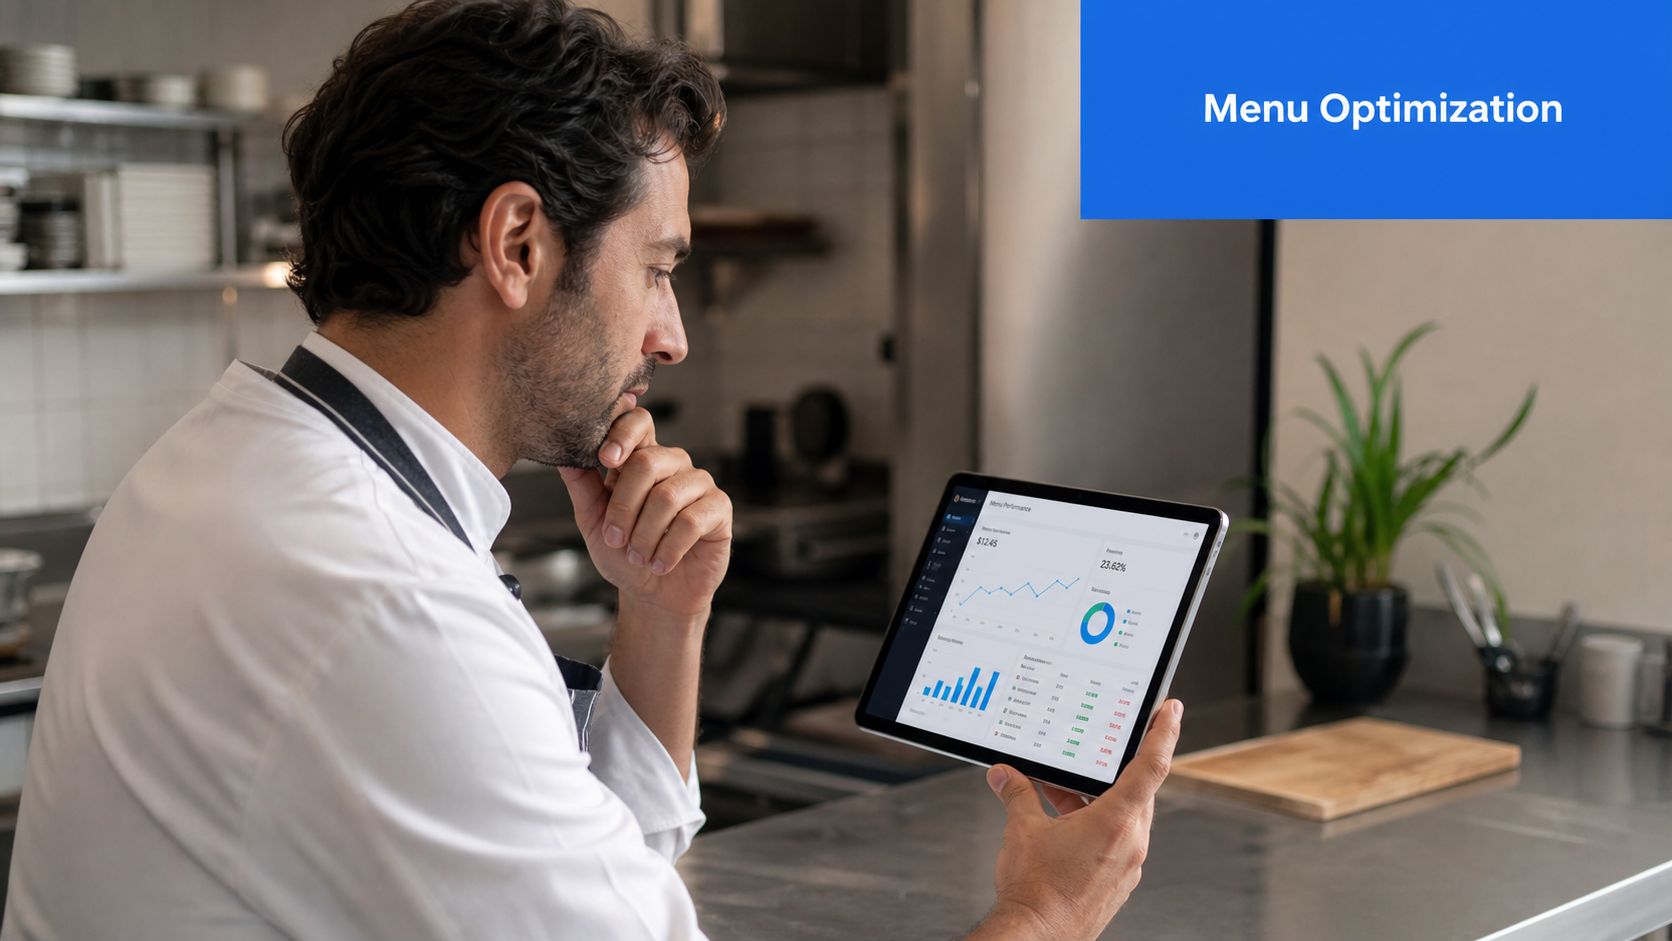
Monthly spreadsheets won't save a weak menu
You need visibility into what's selling, what's profitable, what gets ignored, and how menu placement changes guest behavior.
That's why menu analytics matter so much. They turn food cost percentage calculation from a finance task into a commercial decision system. Instead of just asking what your percentage was, you start asking better questions:
- Which items sell often but don't leave enough margin?
- Which dishes deserve stronger placement?
- Which promotions improve revenue but weaken mix?
- Which add-ons increase average order value cleanly?
- Which menu categories create friction for guests and staff?
What better tracking changes operationally
When operators use live menu performance data well, a few things get easier fast:
- Price changes become less risky: You can watch item movement after a change instead of waiting for a monthly surprise.
- Menu engineering becomes practical: You can spot stars, weak links, and missed upsell opportunities without digging through scattered reports.
- Digital ordering works harder: QR menus and guided ordering can support profitable choices without adding pressure to the floor team.
- Customer experience improves: Guests get clearer menus, faster decisions, and fewer ordering errors.
- Multi-location consistency gets stronger: One update can roll across sites without print lag or version confusion.
The best operators don't just track costs. They track how menu design changes buying behavior.
That's the missing piece in most restaurants. They calculate cost, but they don't connect it to the menu guests see. Once you connect item performance, pricing, ordering behavior, and profitability, better decisions stop feeling reactive.
If you're evaluating systems for this, look for restaurant analytics software built around menu performance and revenue decisions, not just reporting dashboards that dump numbers on your screen.
The smartest operators treat food cost as part finance, part menu strategy, and part guest journey. That's the shift. Calculate it, track it, and use it to shape what customers buy next.
If you want a faster way to turn menu views into stronger margins, RevMenue helps restaurants replace static menus with QR menus, guided upsells, bundles, and real-time menu analytics that make pricing and product decisions easier. It fits alongside your existing POS, updates instantly, and gives you a clearer view of what sells, what drives profit, and where to optimize next.