
Most restaurant owners already have sales data. What they don't have is a clear read on which items are protecting margin, which digital prompts are lifting basket size, and where demand is leaking out every day.
That's the problem with end-of-day reporting. It tells you what sold. It rarely tells you why a guest skipped dessert, why one location's lunch trade converts better than another's, or why a busy menu can still produce weak profit.
Hospitality revenue analytics matters for restaurants, cafés, and multi-site operators. Not as a hotel-style reporting layer. As a practical operating discipline that helps you price smarter, merchandise better, reduce staff pressure, and turn every menu interaction into a revenue decision.
Table of Contents
- Stop Guessing About Profit and Start Growing
- Define Your Goals and Key Metrics
- Unify Your Data for a Single Source of Truth
- Turn Your Dashboard Data into Daily Decisions
- Run Smart Experiments to Grow Your Margins
- Build Repeat Business While Respecting Privacy
Stop Guessing About Profit and Start Growing
You know the drill. Service ends, the numbers come in, and the report says the burger sold well, cocktails were steady, and desserts underperformed. That sounds useful until you ask the only question that matters. Which of those sales made you money?
A lot of owners still run menu decisions on instinct. They keep a low-margin hero because guests talk about it. They leave underpriced items untouched because volume feels reassuring. They blame staff for weak upsells when the actual problem is menu structure, poor digital prompts, or bad item positioning.
Your sales report is incomplete
Most end-of-day reports stop too early. They count transactions. They don't connect item margin, menu placement, scan behavior, and order path.
That gap is expensive. Research on hospitality ancillary revenue and menu pricing challenges notes that 73% of restaurant operators cite menu pricing as their biggest challenge. It also points to a bigger issue: many hospitality analytics setups still miss real-time QR scan behavior and live cost movement, which means operators can't adjust menu recommendations fast enough.
Practical rule: If you only review what sold, you're managing revenue halfway.
A better approach starts with the data you already own:
- POS data shows what was purchased, at what time, and in what combinations.
- QR menu data shows what guests looked at, ignored, opened twice, or abandoned.
- Reservation and traffic data show when demand builds, where bottlenecks hit, and which windows deserve tighter offer design.
- Cost inputs reveal whether a “best seller” still deserves that status.
If you want a cleaner handle on what's really driving profitability, start with a disciplined restaurant P&L structure before you start changing prices.
The real opportunity sits inside the menu
Hotels have spent years optimizing rooms. Restaurants need to get just as serious about per-item menu margin optimization.
That means treating the menu as a live revenue engine, not a static design file. A pasta dish with strong sales but weak contribution margin needs one response. A side item with great margin but weak visibility needs another. A dessert category with high views and low orders tells a completely different story.
Here's what that looks like on the floor:
- A café sees strong afternoon traffic but poor add-on rates. The issue isn't traffic. It's that pastries aren't surfaced at the right moment.
- A casual dining venue moves a lot of signature mains, but guests rarely add premium sides. The issue isn't product quality. It's weak bundle design.
- A multi-location operator finds one site converting far more drinks per cover than another. The issue may be menu sequence, not staff effort.
That's why hospitality revenue analytics matters now. It helps you stop defending assumptions and start fixing the exact points where margin slips away.
Define Your Goals and Key Metrics
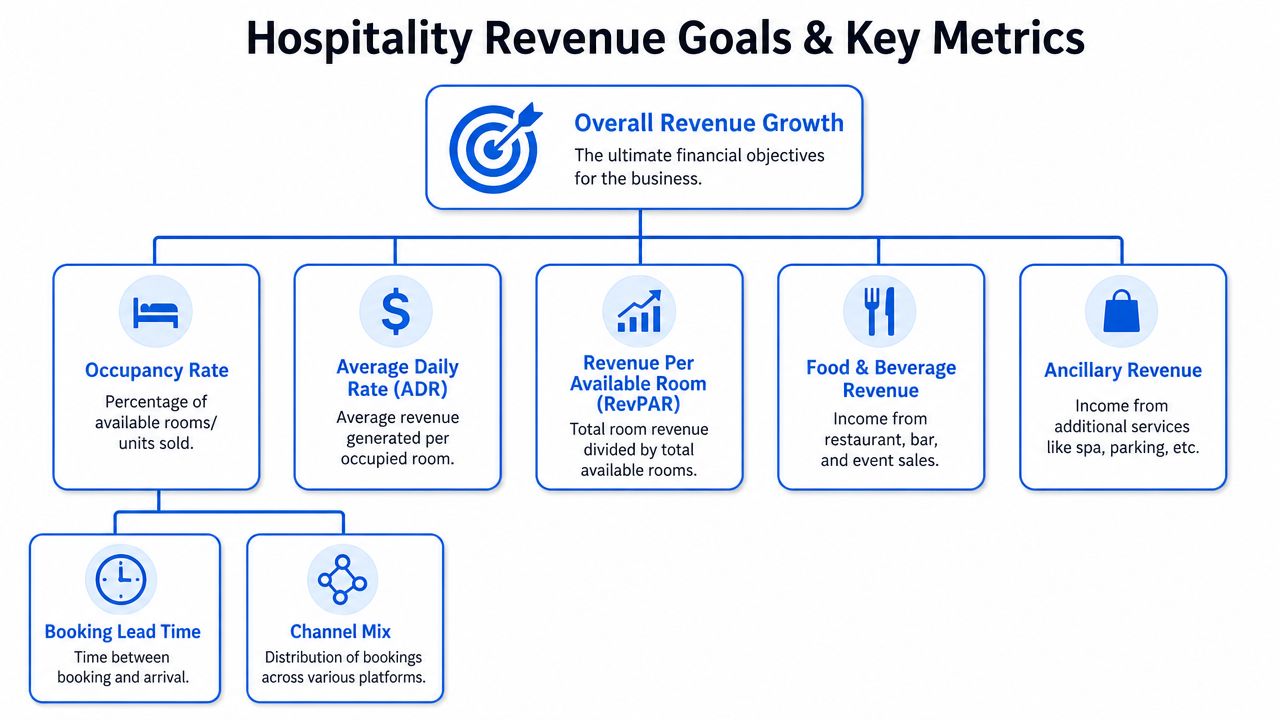
Most operators track too many numbers and act on too few. A useful dashboard doesn't overwhelm your team. It points them toward the next commercial decision.
The hospitality revenue analytics market projection from GMI Insights puts the category at USD 4.1 billion in 2024, with a projection to reach USD 13.1 billion by 2034 at a 12.6% CAGR. That matters because it signals a clear industry shift away from intuition and toward structured, data-led profitability.
Track metrics that change decisions
Start with a small scorecard. If a metric doesn't trigger action, it doesn't belong on the front page.
- Average Order Value tells you whether prompts, bundles, and upsell training are working. If AOV rises, your menu is helping guests build a better basket.
- Revenue Per Available Seat Hour helps you judge trading efficiency by daypart. A full room with slow turns can still underperform.
- Item-level contribution margin shows which dishes deserve promotion and which ones drain profit.
- Repeat customer rate tells you whether your experience and follow-up strategy create habit, not just one-off traffic.
- Category conversion matters in digital ordering. If guests open desserts often but rarely buy, your issue is likely offer design, pricing, or timing.
Build a scorecard your managers will actually use
Your managers need business questions, not abstract KPIs. Use the number to force a decision.
| Metric | What it answers |
|---|---|
| AOV | Are guests adding enough to each order? |
| RevPASH | Are we using seats well during peak and shoulder periods? |
| Item margin | Which products deserve more visibility and which need rework? |
| Repeat rate | Are guests finding enough value to come back? |
| Category conversion | Which part of the menu attracts interest but fails to close? |
Don't ask your team to “watch the numbers.” Ask them to explain one movement and one response.
For example:
- If AOV is rising, keep the upsell prompts that are working.
- If AOV is flat, check whether your meal deals feel relevant or forced.
- If RevPASH is weak at lunch, tighten the menu, improve prep flow, or push faster bundles.
- If item margin is poor on a best seller, review portioning, pricing, and what you pair it with.
For operators building a smarter reporting stack, this kind of restaurant KPI framework is far more useful than generic top-line dashboards.
Unify Your Data for a Single Source of Truth
If your POS says one thing, your booking tool says another, and your QR menu sits in a separate system, you don't have analytics. You have fragments.
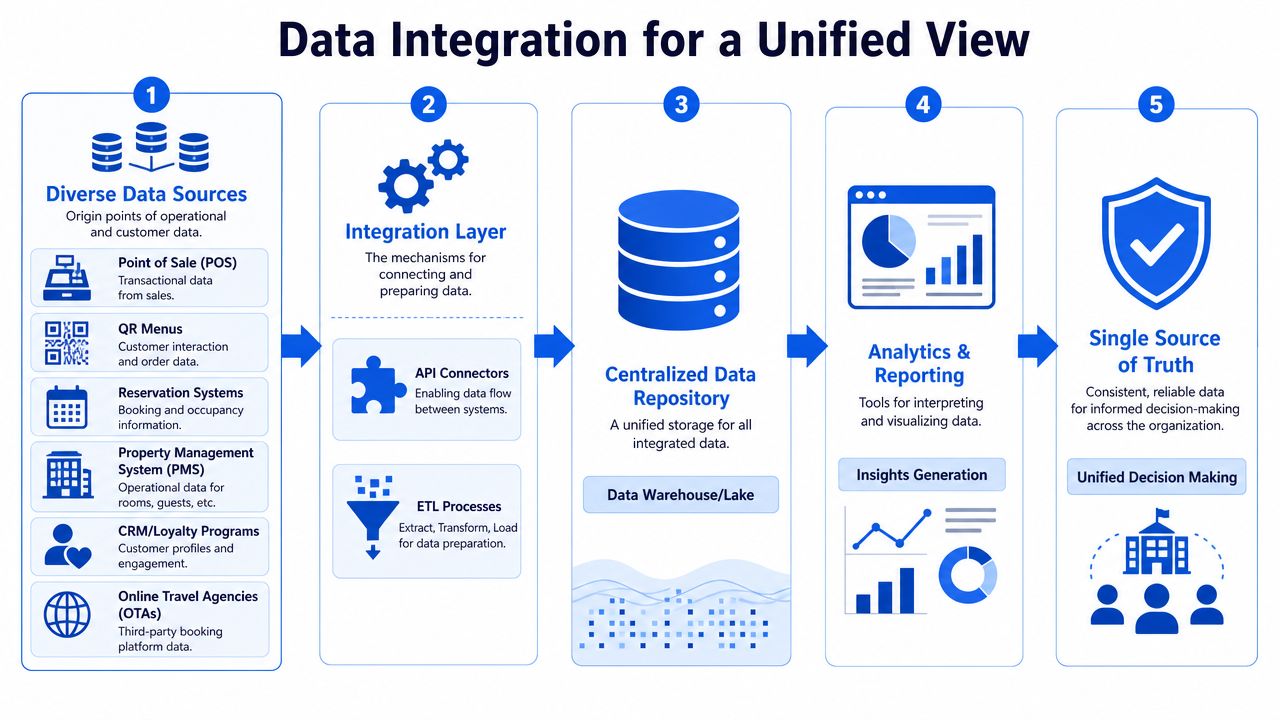
Good operators don't need more raw data. They need one reliable view that connects guest behavior, sales, demand, and follow-on actions.
Every system tells a different part of the story
The cleanest way to think about this is like a kitchen pass. Ingredients arrive from different stations, but the dish only works when everything lands together in the right place.
The same applies to hospitality revenue analytics.
- POS shows completed transactions. It tells you what guests bought and how baskets were built.
- QR menu data shows intent before payment. It tells you what guests considered, compared, and skipped.
- Reservation systems show demand patterns by day, time, and party type.
- CRM or loyalty data helps you understand return behavior and which offers create habit.
- Operational systems show whether staffing and service speed support the revenue opportunity you're trying to capture.
IDEAS revenue management guidance makes a useful point from the wider hospitality world. Strong revenue analytics depends on integrating real-time data from the PMS, CRS, and CRM, and one common failure is not tracking Turnaways, meaning requests or reservations not booked. For restaurants, the equivalent problem shows up when operators track orders but ignore abandoned scans, unavailable booking slots, or menu categories guests wanted but couldn't complete.
What a unified view looks like in practice
A unified view doesn't mean replacing every tool you already use. It means connecting them well enough that managers can answer practical questions fast.
For a single location, that might look like this:
- One dashboard for lunch that combines reservations, walk-ins, ticket times, item sales, and QR category views.
- One promotion report that shows whether a bundle lifted basket size or just discounted items guests would have bought anyway.
- One product view that combines sales volume with contribution margin and digital conversion.
For a multi-location group, the value is even bigger.
One site might have stronger beverage attachment because the menu order is cleaner. Another might underperform on repeat visits because mobile ordering is clunky. Without standardized data definitions, you won't spot that quickly.
A location isn't “underperforming.” Usually, one part of its system is.
Use a simple integration checklist:
- Standardize item names so the same dish isn't tagged three ways across stores.
- Match time windows so lunch means the same thing in every report.
- Connect digital interactions to order outcomes where possible.
- Track lost demand, including failed bookings, unavailable items, and high-view low-order categories.
- Give managers one version of the truth, not five exports and a spreadsheet debate.
If your current setup makes that difficult, look for restaurant analytics software that works alongside existing systems instead of forcing a disruptive rip-and-replace.
Turn Your Dashboard Data into Daily Decisions
A dashboard is only useful if it changes what your team does before the next shift. Otherwise, it's decoration.
NetSuite's hospitality analytics overview notes that hotels using AI-powered revenue management systems report an average 25% increase in RevPAR, driven by breaking revenue streams down to show where money is made or lost. Restaurants should take the same lesson and apply it to seats, menu categories, and add-ons.
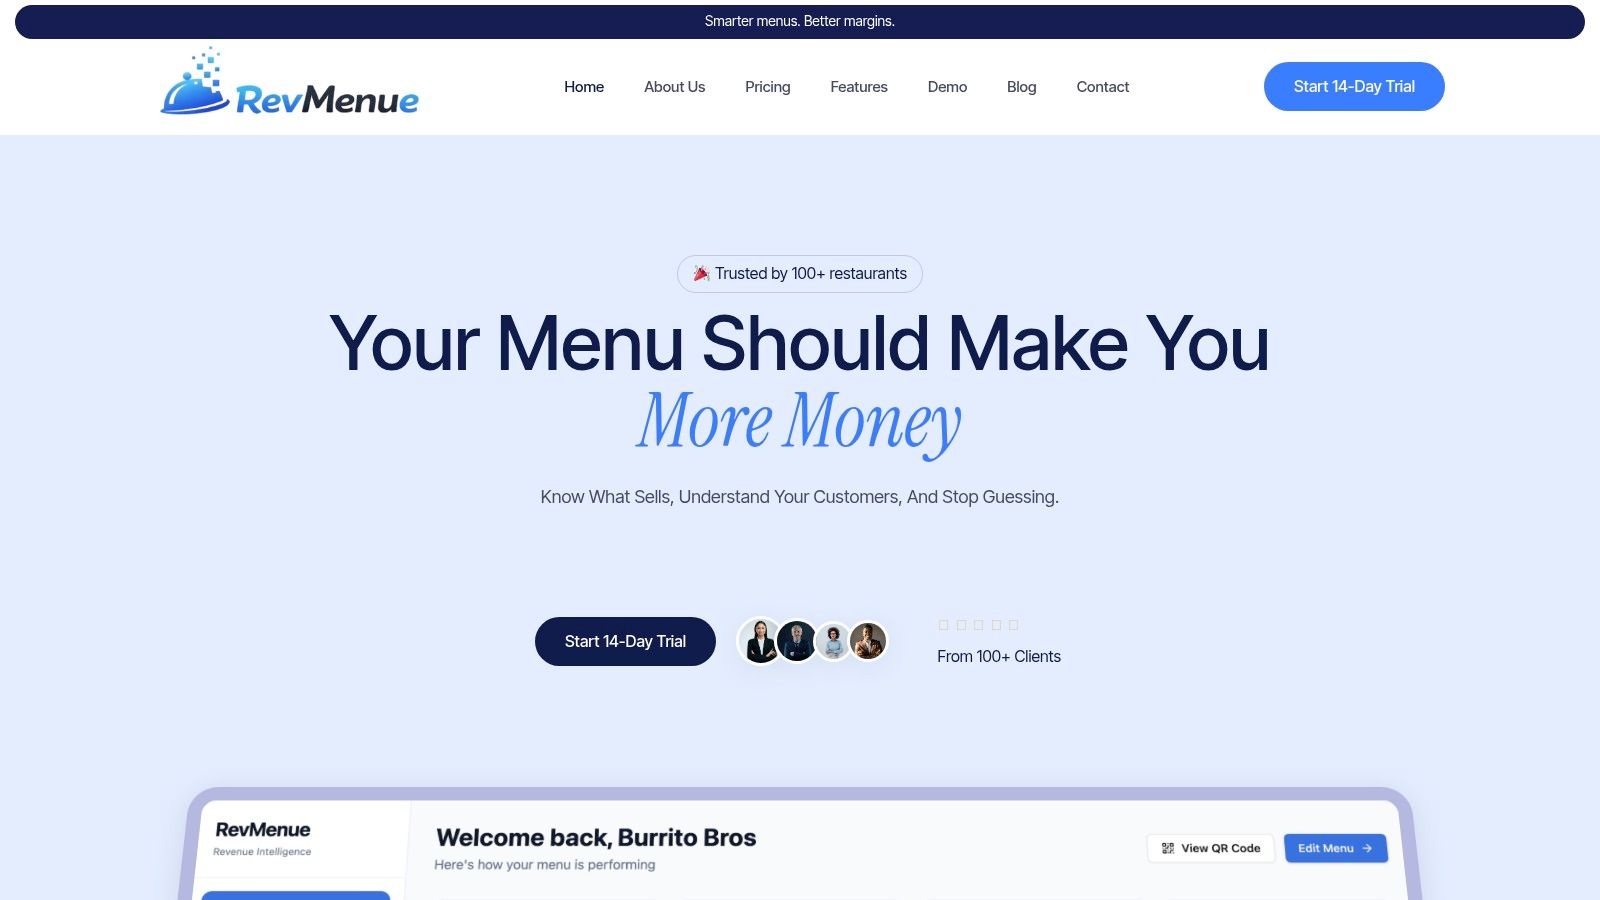
Near the start of that process, the right interface matters.
When a popular item isn't a good item
Your dashboard shows the house burger is one of the top sellers. Most managers stop there. Don't.
Ask better questions:
- Is the margin strong enough?
- Are guests swapping profitable sides for lower-margin ones?
- Is the burger pulling through drinks or killing add-on opportunities because it already feels “complete”?
A smart move might be to keep the core item unchanged but redesign the path around it. Put premium fries, a branded drink, or a dessert prompt directly after selection. If guests love the burger, use that demand to carry more profitable attachments.
Popularity without margin is workload.
When menu views don't convert
Say your QR menu shows heavy traffic to desserts, but orders stay weak. That's not a kitchen issue yet. It's a merchandising issue first.
Look at the likely causes:
- The photography or naming creates interest, but the price creates hesitation.
- The category appears too early or too late in the order journey.
- Guests don't see a reason to add dessert after mains.
- Service timing makes the prompt easy to ignore.
Try operational fixes before rewriting the whole menu. Move desserts into a clearer position. Create a lighter after-dinner bundle. Add a prompt tied to coffee or a digestif.
A short product walkthrough helps here:
When service pressure is really a revenue problem
Another common dashboard signal is strong volume during a peak window paired with weak spend per guest. Operators often call this a staffing problem. Sometimes it is. Often it's a menu design problem wearing an operational mask.
Here's a realistic example:
- The café hits a rush.
- Staff focus on speed.
- Guests choose obvious items fast.
- High-margin add-ons get skipped because no one has time to suggest them.
The answer isn't to tell the team to “upsell harder.” The answer is to let the ordering system do more of that work.
Use data to decide where prompts belong:
- At item selection for premium modifiers
- Before checkout for side additions
- After a core item for beverages
- In off-peak windows for slower, higher-margin products
When you look at dashboards this way, the point isn't reporting. The point is making the next shift more profitable and less chaotic.
Run Smart Experiments to Grow Your Margins
Most operators treat the menu as something they update a few times a year. That's too slow.
Your menu should behave more like a live sales tool. Test, adjust, measure, repeat. Small experiments beat big redesigns because they carry less risk and teach you faster.
Use bundles and prompts with intent
One of the simplest ways to improve margin is to stop selling isolated items when a bundle would serve the guest better and increase basket size at the same time.
AB Tasty's guidance on bundling and Average Order Value gives a clear retail example: bundling complementary products and showing 20% savings can lift perceived value and encourage customers to buy a fuller set instead of a single item. The restaurant version is obvious. A meal deal, coffee-and-pastry set, or lunch combo works best when it feels useful, not random.
Use that logic carefully:
- High-volume anchor item: Pair it with a side or drink that carries stronger margin.
- Afternoon slump: Build a snack bundle that shortens choice and speeds ordering.
- Family dining: Offer combinations that reduce decision fatigue for groups.
- Bar service: Create pairings that move guests from one drink to a second round plus a shareable plate.
Test pricing and placement, not just recipes
Operators love testing food. They avoid testing price. That's backwards.
If an item has strong demand and stable guest acceptance, test a controlled price adjustment. If a category gets traffic but weak orders, test placement first. If a profitable add-on underperforms, test the prompt language or order sequence.
Try experiments like these:
- Reposition a profitable side higher in the menu flow and watch attachment.
- Turn a weak seller into a bundle component instead of promoting it alone.
- Reduce clutter in a crowded category so the top-margin item stands out.
- Adjust naming when a product is good but easy to overlook.
- Separate premium modifiers clearly so guests understand the upgrade path.
A useful rule is to test one lever at a time. If you change price, image, placement, and copy all at once, you won't know what worked.
Operator note: The safest experiments are the ones guests barely notice and your margin definitely does.
You should also use loyalty mechanics where they fit. Core dna's write-up on spending-based loyalty and AOV notes that loyalty programs tied to spend increase Average Order Value by an average of 13.71%. For restaurants, that means rewarding the behavior you want. Not just visits, but profitable visits.
The main point is simple. Reporting tells you what happened. Experiments decide what happens next.
Build Repeat Business While Respecting Privacy
A lot of operators think personalization requires an app, a login, and a pile of personal data. It doesn't.
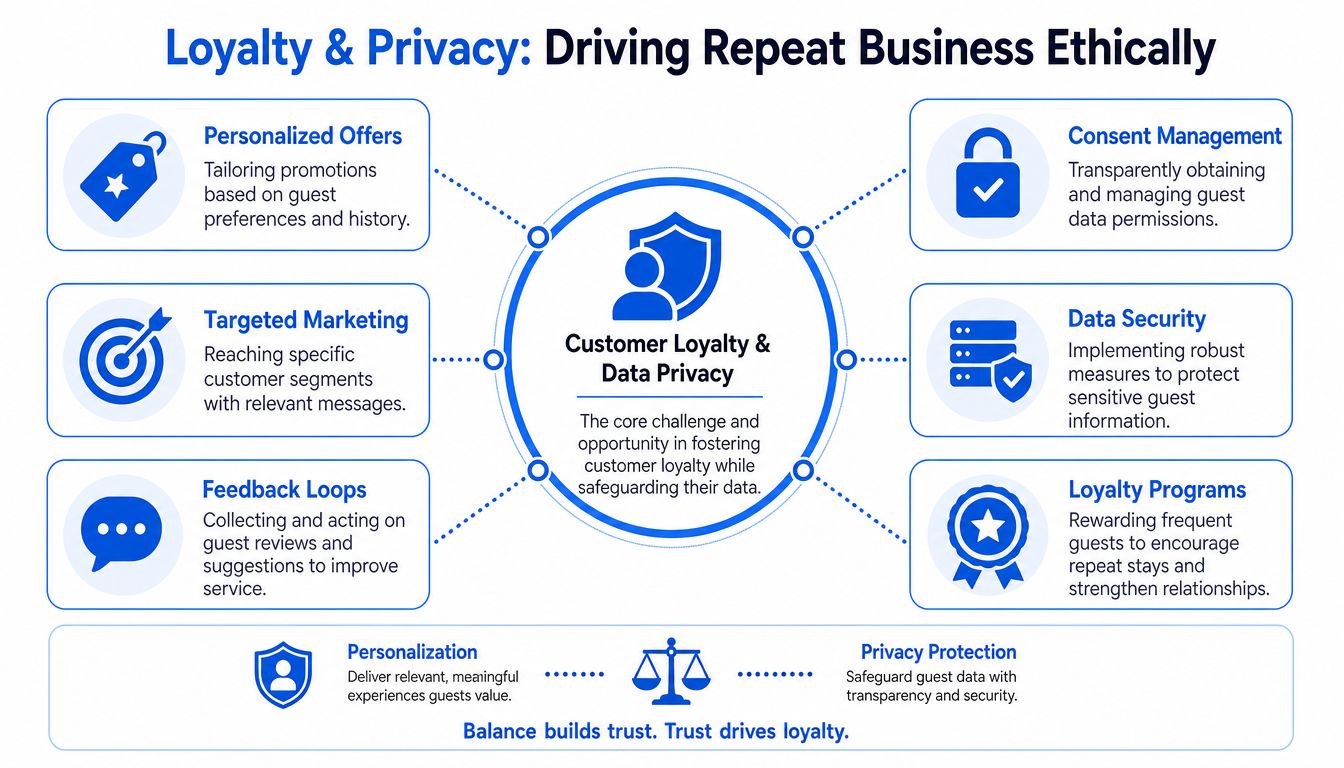
The smarter path is privacy-first personalization. Use behavior, context, and consent to make ordering more relevant without crossing the line into creepy tracking.
Personalization doesn't require creepiness
Hotel News Resource's coverage of privacy-first personalization in hospitality highlights a question operators keep running into: how to use scan-level data for personalized marketing without violating GDPR. It also notes that 60% of hospitality groups seek privacy-first personalization, while practical guidance for anonymous, app-less QR environments is still thin.
For restaurants, the answer is operational, not theoretical.
You can personalize responsibly by focusing on signals like:
- Category preference such as repeat interest in plant-based, gluten-free, or no-alcohol options
- Time-based behavior like guests who reliably buy coffee in the morning and snacks later
- Order patterns such as frequent side additions or dessert-first behavior
- Location context including the venue, daypart, and service style
What you shouldn't do is collect more personal data than you need.
Use a privacy-first standard:
- Ask clearly for consent when you want to remember preferences or send marketing.
- Keep data handling narrow so you store only what improves service.
- Use aggregated behavior when you can improve offers without identifying the individual.
- Make opt-out simple because trust matters more than one extra campaign.
A simple operating loop for repeatable growth
The operators who win with hospitality revenue analytics keep the process tight.
- Define the commercial question. Are you trying to lift AOV, improve category conversion, or drive repeat visits?
- Gather data from sales, scans, bookings, and feedback in one place.
- Interpret what guests are doing, not what you assume they're doing.
- Experiment with prompts, bundles, pricing, and timing.
- Grow by keeping what works and removing what doesn't.
That loop is what turns a digital menu into a revenue system.
It also lowers friction for the team. Staff spend less time pushing awkward upsells. Guests get more relevant options. Managers stop making pricing decisions from memory. Everyone works from the same commercial picture.
If you want a practical way to put that loop into action, RevMenue is built for it. It helps restaurants, cafés, and hospitality teams turn QR scans into smarter menu decisions, stronger add-ons, privacy-friendly personalization, and better margin visibility without ripping out the systems they already use.