
Most restaurants lose revenue through pricing guesswork.
A new burger launches. It sells fast at first, then slows down. You raise the price and volume drops harder than expected. You discount it and the kitchen gets slammed, but profit barely moves. The problem usually isn't the item. It's that you don't yet know how demand changes as price changes.
That's where a demand schedule becomes useful. Not as a classroom diagram, but as a working tool for menu pricing, specials, bundles, and digital promotion timing. If you've ever asked, “What does a demand schedule show?” the practical answer is simple. It shows how many units guests are willing to buy at different price points, while other factors stay the same. For an operator, that's the difference between pricing on instinct and pricing with intent.
Table of Contents
- Why Some Menu Items Sell Out and Others Barely Move
- What a Demand Schedule Actually Shows
- From a Simple Table to a Powerful Pricing Map
- How to Uncover Your Restaurant's Demand Schedule
- Price Changes vs Demand Shifts A Critical Difference
- Putting Demand Insights into Action
Why Some Menu Items Sell Out and Others Barely Move
A restaurant owner adds a new seasonal flatbread. At one price, tables order it easily, but the margin feels thin. At a higher price, guests hesitate and servers stop recommending it because it suddenly sounds expensive next to the rest of the menu. That's a familiar problem in hospitality. You're not just setting a price. You're managing perceived value, kitchen flow, and guest behavior all at once.
Some items look popular but aren't strong profit drivers. Others have healthy margins but stall because the price sits just above what guests are comfortable paying. When operators don't map that relationship, they end up making reactive decisions. They discount too early, overcorrect after one slow week, or keep weak menu items around because “people like them” without checking whether people still buy them at the current price.
A demand schedule helps clean that up. It gives you a simple view of how quantity demanded changes when price changes. In restaurant terms, it helps answer practical questions like:
- Should this lunch combo be priced lower to drive volume, or higher to protect margin
- Does this premium cocktail still move if we take away the promo
- Is the issue the dish itself, or the price point
- Would a digital special perform better as a bundle than as a discount
Practical rule: If you can't explain how sales volume is likely to change when price moves, you're not really pricing. You're testing your luck.
This matters even more when you're working with menu engineering and restaurant data analytics for smarter pricing decisions. Good operators already track sales. Stronger operators track how sales respond.
That's the difference between “best-seller” thinking and commercial thinking.
What a Demand Schedule Actually Shows
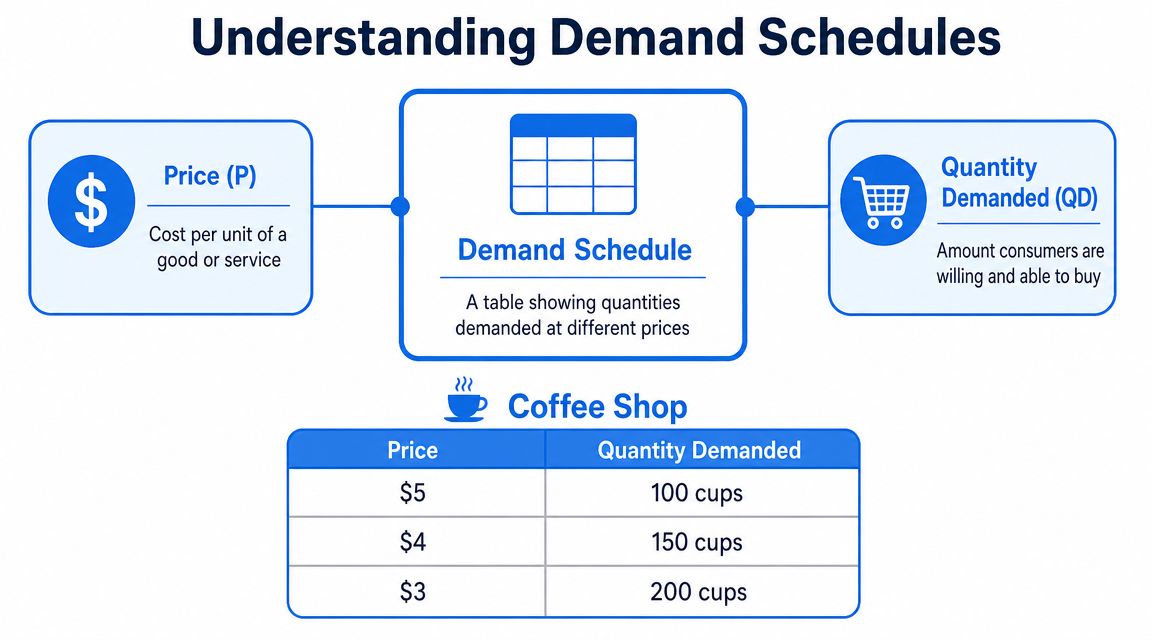
A demand schedule is a table showing how much of a good consumers are willing to buy at different price levels. One instructional example shows consumers buying 13 units at $7 and only 6 units at $14, which illustrates the basic inverse relationship between price and quantity demanded, as explained in this demand schedule overview.
For a restaurant, that means lining up possible prices for one item and tracking how many orders you get at each one.
The simplest way to read it
Think of a signature smash burger. You don't need a complex model first. You need a clean table.
| Price | Likely demand |
|---|---|
| Lower price | More guests order it |
| Mid price | Fewer guests order it |
| Higher price | Only the most interested guests order it |
That's the heart of the answer to what does a demand schedule show. It shows the relationship between your item's price and the quantity guests will buy.
It does not tell you whether the item has a good food cost. It does not tell you whether the plating is slow. It does not tell you whether a nearby event drove traffic that night. It isolates the price-to-demand relationship so you can make a clearer call.
Why operators should care
This sounds basic, but it changes real decisions fast.
- Pricing new items: You stop asking “What should this cost?” and start asking “At what price does this item perform best for the business?”
- Running promotions: You can judge whether a price drop is creating useful volume or just cheap volume.
- Training staff: You learn which items need better framing and which ones are overpriced.
- Building QR menus: You can test demand by changing prices or bundles without reprinting anything.
A demand schedule turns scattered sales observations into something you can actually use.
In practice, that's why it matters. It gives structure to behavior you're already seeing every day on the floor.
From a Simple Table to a Powerful Pricing Map
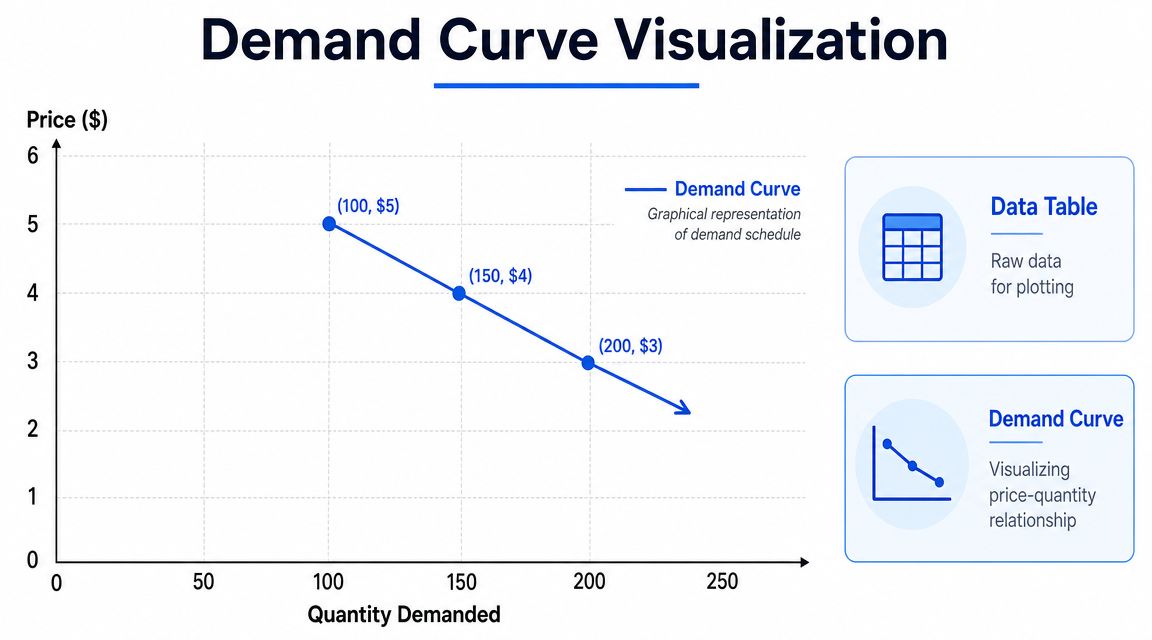
Once you have the table, you can plot it as a demand curve. That sounds academic, but the value is practical. A curve lets you see the relationship in one glance instead of scanning rows of numbers.
An instructional market example shows buyers demanding 25 million barrels per day at $20 per barrel and only 5 million barrels per day at $55 per barrel. Plotting those price and quantity pairs creates the classic downward-sloping demand curve, as shown in this explanation of graphing a demand curve from a demand schedule.
Why the curve matters in restaurants
Restaurants use this logic all the time without naming it.
Happy hour works because lower prices often increase quantity demanded. An early dinner offer works for the same reason. A premium add-on stalls when the price crosses a threshold guests don't like. The curve helps you visualize those trade-offs.
That matters when you're doing restaurant menu optimization for profit and guest behavior. You're not just asking whether sales go up or down. You're asking where the strongest balance sits between volume, margin, and operational pressure.
What the visual helps you decide
A pricing map is useful because it makes trade-offs visible.
- Where volume falls sharply: That may be the point where guests stop seeing value.
- Where a small price increase holds demand reasonably well: That can signal room to improve margin.
- Where promotions create too much low-value traffic: Useful for avoiding deals that fill seats without lifting profit.
- Where bundles might outperform straight discounts: Guests often respond better to framed value than to a basic price cut.
Operator lens: The best price isn't always the one that sells the most units. It's the one that supports profit, service pace, and guest satisfaction at the same time.
A table gives you raw input. A curve gives you decision speed. In a busy restaurant, that speed matters.
How to Uncover Your Restaurant's Demand Schedule
You don't need a finance team to build a useful demand schedule. You need one item, a few controlled price points, and enough discipline to record what happened.

The fastest wins usually come from items that already create friction. A premium burger nobody can quite price confidently. A side dish that sells inconsistently. A cocktail that works during promos but softens at full price. Those are better test candidates than staple items with stable demand.
Start with items that already have pricing tension
Pick one category where pricing uncertainty affects revenue or flow.
A few good candidates:
- Signature items: These often carry the strongest branding, so small pricing errors matter.
- Add-ons and sides: Ideal for testing because they influence average order value.
- Limited-time offers: Guests don't have fixed expectations yet, which gives you cleaner feedback.
- Bundles: Strong for seeing whether perceived value beats straight item-level discounting.
Keep the test conditions as stable as you can. Same item. Same portion. Same menu description. Same service window if possible.
Low-friction ways to collect the data
You can build a practical demand schedule with tools most operators already have.
- Use your POS history: Review periods when the same item sold at different prices and compare unit movement.
- Test one price at a time: Run a weekly special at one price, then adjust it later instead of changing multiple variables at once.
- Try digital menu testing: QR menus make it easier to change a side price, bundle structure, or promo wording without operational mess.
- Compare matched windows: Lunch should be compared with lunch, not lunch with Saturday night dinner.
- For multi-location groups: Use one location as a test market before rolling changes wider. That's easier when you're using multi-location restaurant forecasting software.
What doesn't work is random discounting. If you cut the price, change the photo, rewrite the description, and launch a promo all at once, you won't know what caused the result.
What to record each time
Track the commercial context, not just the sales count.
| What to note | Why it matters |
|---|---|
| Price used | This is the core variable |
| Units sold | Your quantity demanded |
| Daypart | Lunch and dinner behave differently |
| Promotion status | A featured placement can distort demand |
| Nearby conditions | Events, weather, and local traffic can affect results |
| Attachment rate | Useful if the item helps drive drinks, sides, or dessert |
Here's a short explainer if your team needs a quick visual refresher before testing:
You don't need perfect data to begin. You need cleaner observations than you had last month. That's usually enough to spot whether a price is helping the business or hurting it.
Price Changes vs Demand Shifts A Critical Difference
One of the biggest pricing mistakes in restaurants is blaming the wrong thing.
You lower the price of a cocktail during a quiet window and orders increase. That's one type of change. A new office crowd starts filling the neighborhood and now cocktail demand rises across the board. That's a different type of change entirely.
A movement is your price decision
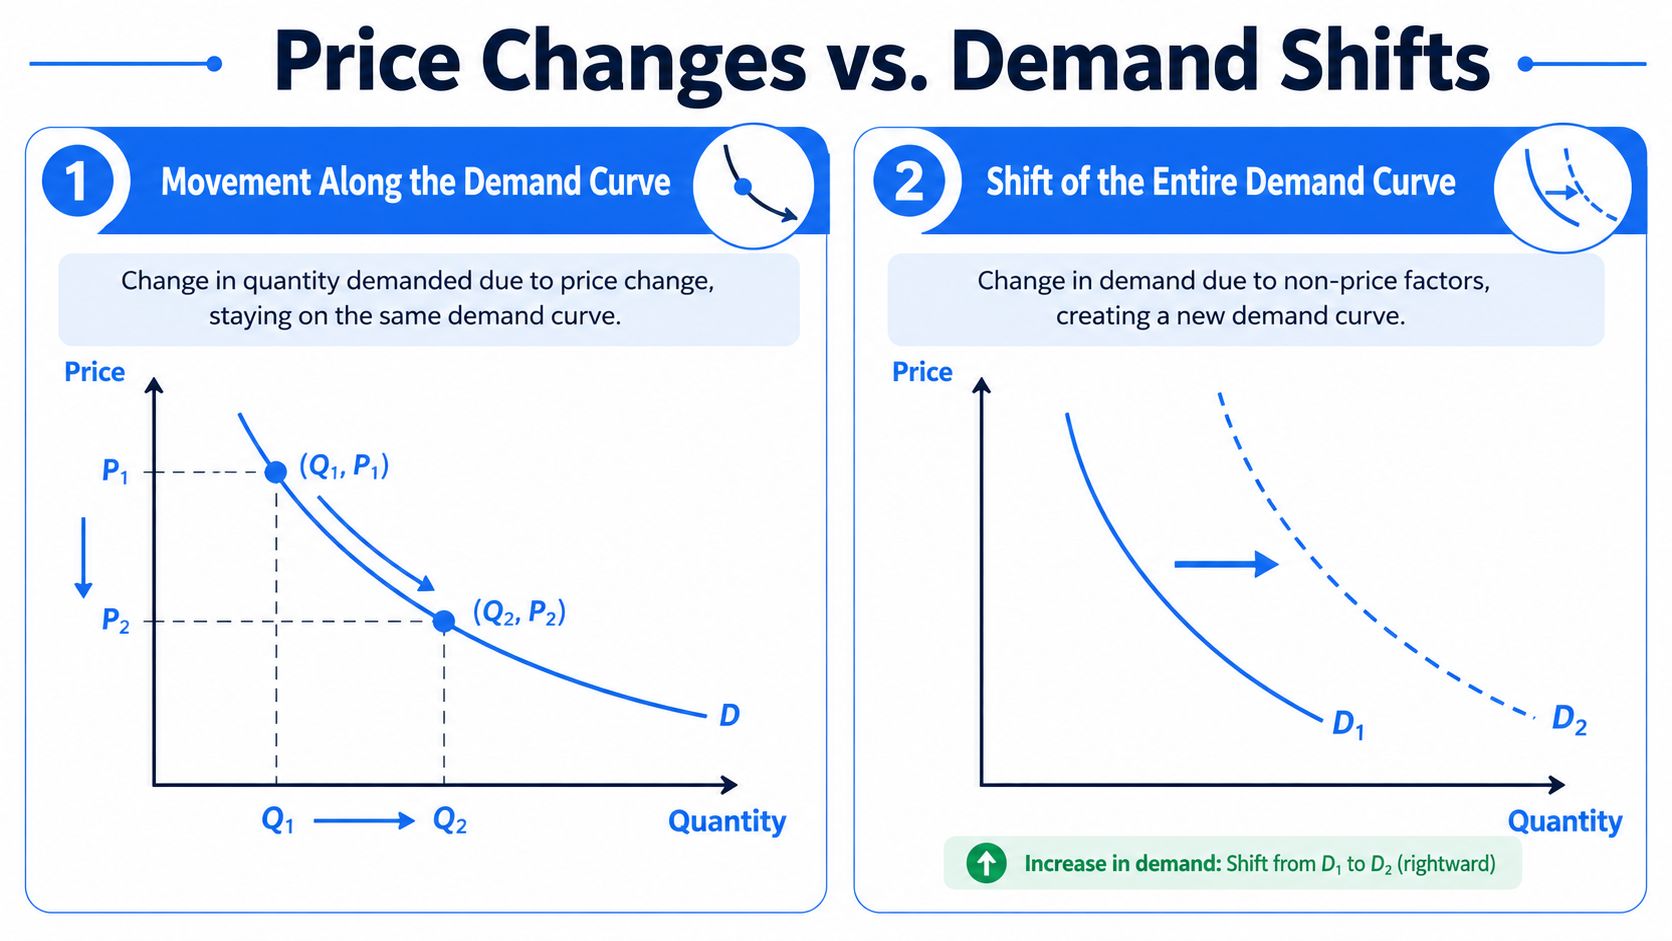
A simple demand schedule works under a ceteris paribus assumption, meaning all else is held equal. It shows the relationship between a product's own price and quantity demanded while factors like income, tastes, and competitor prices are held constant, as described in this explanation of the limits of a demand schedule.
In restaurant terms, a movement along the demand curve happens when you change the item's own price.
Examples:
- You cut the happy hour wine price and sell more glasses.
- You raise the price of a premium dessert and fewer tables add it.
- You lower the lunch combo price and increase unit sales during that window.
That's quantity responding to price. Same curve. Different point on it.
A shift is the market changing around you
A demand shift happens when non-price factors change.
Examples:
- A local event starts driving more foot traffic.
- A competitor closes, so more guests consider your restaurant.
- A menu item goes viral on social media.
- Seasonal preferences change and guests suddenly want lighter dishes.
Don't confuse stronger traffic with better pricing. Sometimes the market moved, not your strategy.
This distinction matters because the wrong diagnosis leads to bad decisions. If demand rose because the neighborhood changed, copying the same price move later might disappoint you. If demand fell because tastes changed, discounting may only protect volume briefly while margin erodes.
Good operators separate pricing effects from market effects before they touch the menu again.
Putting Demand Insights into Action
A demand schedule is more than the raw input for a demand curve. It also lets a business infer the maximum price a consumer is willing to pay for a given unit, which is useful for marginal pricing analysis and value-based pricing, as outlined in this overview of demand functions and schedules.
That's the practical payoff.
If you understand what a demand schedule shows, you can stop treating menu pricing like a one-time setup task. You start using it as an ongoing operating discipline.
Use it to make sharper calls such as:
- Set launch prices with more confidence: Especially for seasonal items and premium additions.
- Protect average order value: Test whether bundles, sides, and add-ons hold demand better than straight discounts.
- Reduce staff guesswork: Give servers prices and promotions that already make sense commercially.
- Improve digital menus: Move high-potential items into better positions once you know guests respond at the current price.
- Spot weak offers early: If demand falls off too quickly at a given price, fix the value story or replace the item.
The goal isn't to find one perfect price forever. The goal is to understand how guests respond so you can keep adjusting with purpose.
Restaurants that do this well don't necessarily have bigger teams. They usually have tighter feedback loops. They watch what changes, isolate why it changed, and act faster than operators who rely on instinct alone.
RevMenue helps restaurants turn menu behavior into practical revenue decisions. If you want QR menus, upsell flows, and menu analytics that make pricing and promotion testing easier without adding staff workload, take a look at RevMenue.