
Most restaurants lose margin through the menu long before they see the problem in the P&L.
You know the pattern. One dish flies out of the kitchen all week, the team recommends it without thinking, guests love it, and yet the plate barely leaves anything behind after ingredients, prep time, and waste. Another item sells less often but still does far more for profit. If you're not measuring both, you're steering with half the dashboard covered.
That's where menu analysis matters. At its best, it isn't a spreadsheet exercise. It's a practical way to decide what stays, what gets pushed, what gets reworked, and what should leave the menu before it keeps draining labor, stock, and cash.
Table of Contents
- Your Busiest Dish Might Be Your Least Profitable
- The Four Types of Items on Every Menu
- The Only Two Metrics That Truly Matter
- A Practical Step-by-Step Menu Analysis Framework
- Common Menu Analysis Pitfalls and How to Fix Them
- From Analysis to Action with Smarter Menus
Your Busiest Dish Might Be Your Least Profitable
A lot of owners first ask what is menu analysis when they realize their best seller isn't helping the bank balance as much as expected.
Take a common situation. A café has a chicken sandwich that's ordered constantly at lunch. It looks like a winner because it drives volume. But once you account for the protein portion, garnish, side, sauce, packaging for takeaway, and the time it takes to prep and plate, the margin is thin. Meanwhile, a grain bowl or pasta dish with better cost control may contribute far more profit every time it sells.
That gap is exactly why menu analysis matters. It shows which items create demand and which items create profit, and those aren't always the same thing.
According to menu engineering analytics research, menu analysis enables restaurants to improve gross margins by 2.5% to 4.2% within 12 months by eliminating low-performing dishes and optimizing high-profit, high-demand items. That's not a design tweak. That's a bankable operating improvement.
What menu analysis actually does
At a practical level, menu analysis helps you answer questions like these:
- Which item sells well but underperforms financially
- Which dish has strong profit but weak visibility
- Which menu section creates unnecessary stockholding
- Which low sellers add kitchen complexity without earning their place
- Which items deserve server attention and better placement
Practical rule: If an item is busy but not profitable, don't celebrate it yet. Audit it.
Owners usually look first at food cost percentage, total sales, or what regulars mention most. Those matter, but they don't tell the full story. Menu analysis forces a clearer view. It connects the guest-facing menu to prep burden, waste, pricing, and contribution to overhead.
Why this matters beyond the menu
Menu decisions affect more than plate profit.
They affect:
- Purchasing discipline
- Stock waste
- Speed of service
- Staff confidence in upselling
- How easy it is to train new team members
If you're also reviewing broader efficiency issues, this guide on how to learn to cut restaurant operating costs is worth pairing with menu work, because the menu usually sits at the center of those cost leaks.
The Four Types of Items on Every Menu
Every menu item falls into a role. Once you see that clearly, decisions get easier.
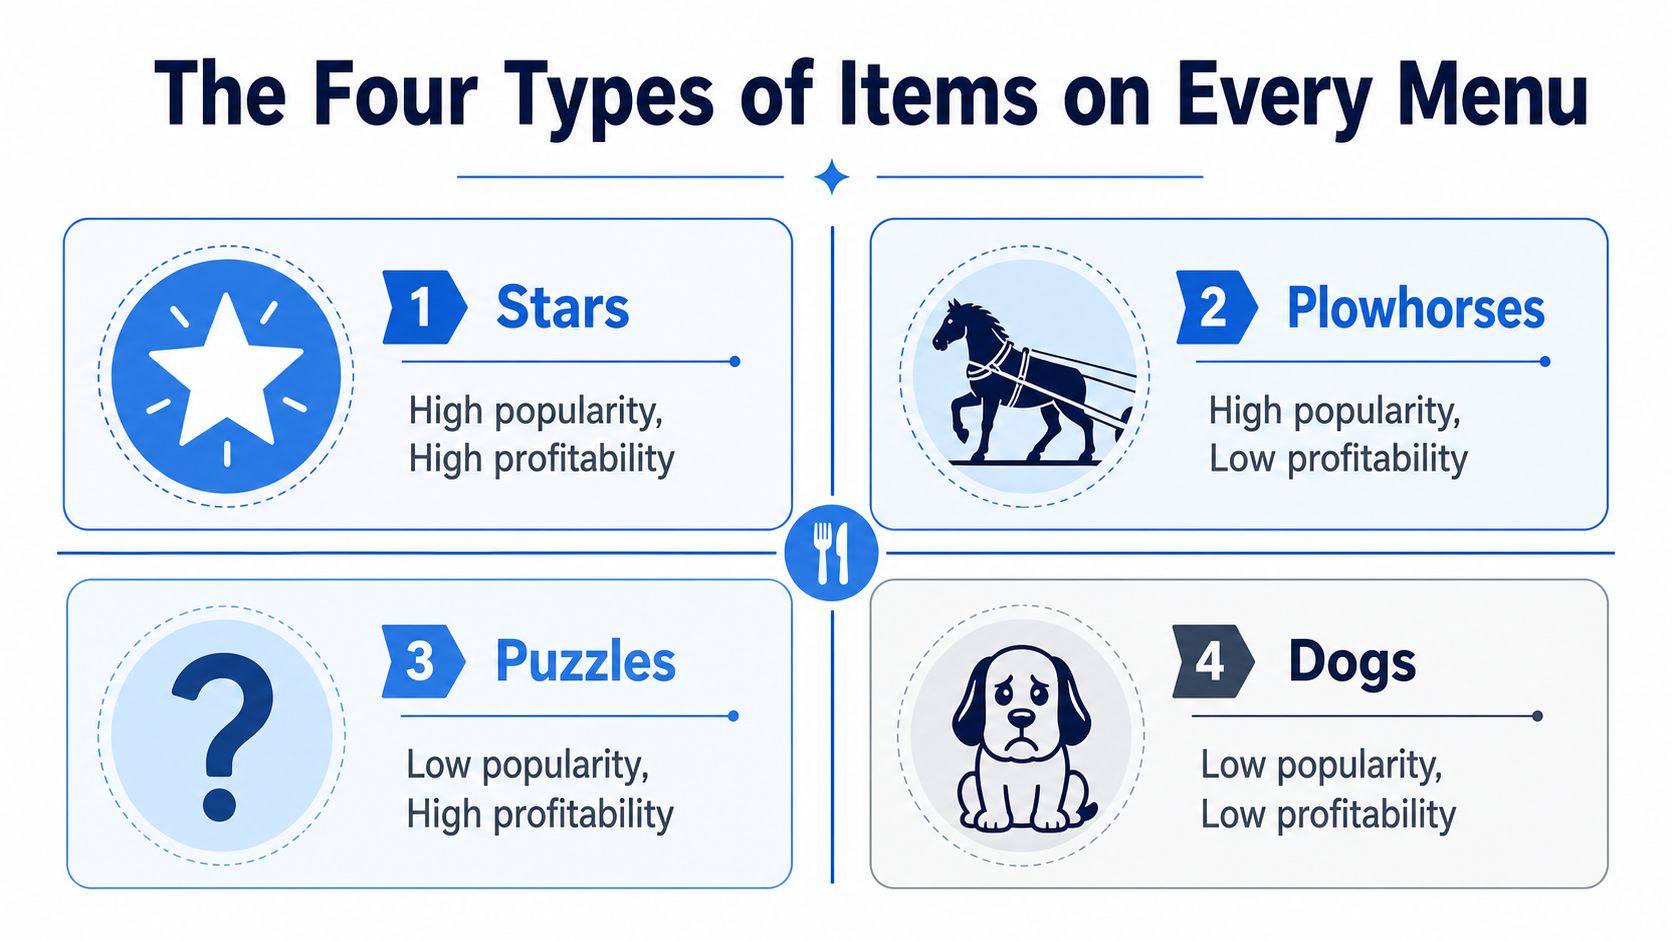
The simplest way to classify dishes is to plot each one on a 2×2 menu engineering matrix using popularity and contribution margin, which sorts them into Stars, Plowhorses, Puzzles, and Dogs according to RestroFi's menu engineering overview.
Think of the menu like a team sheet
Some dishes carry the business. Some work hard but need help. Some have talent but nobody notices them. Some shouldn't make the lineup.
Here's the practical view:
| Item type | What it means in service | What it usually needs |
|---|---|---|
| Stars | Guests order them often and they make good money | Protect quality, feature them, train staff to recommend them |
| Plowhorses | They're popular but margin is weak | Tighten portioning, review price, add profitable extras |
| Puzzles | They make good money but guests overlook them | Better placement, stronger descriptions, smart promotion |
| Dogs | They sell poorly and don't earn much | Remove, simplify, or move off the core menu |
How to act on each type
Stars are the items you don't mess with casually. If a steak frites, breakfast wrap, or signature latte performs this well, keep execution tight. Highlight it on the menu. Make sure every shift can deliver it consistently.
Plowhorses are where many operators get stuck. These are the crowd-pleasers that clog the pass and disappoint the margin. Often the fix isn't dramatic. It may be a small portion adjustment, a side swap, or a better upsell path.
A busy item can still be a weak business item if guests love it more than your margin does.
Puzzles frustrate owners because they should be doing better. Usually the issue isn't the dish itself. It's visibility, naming, placement, or how staff talk about it. A profitable salad tucked at the bottom of a crowded section won't get a fair chance.
Dogs need honest handling. Operators often keep them because one regular orders them, or because the chef likes the idea. But low popularity and low profitability is a hard combination to defend on a working menu.
When teams start using this framework, conversations improve fast. Instead of saying “that item feels slow” or “guests don't seem into it,” you can say, “that's a Puzzle, so let's test visibility before we cut it,” or “that's a Dog, so it shouldn't keep taking fridge space.”
The Only Two Metrics That Truly Matter
Friday dinner service ends. The POS says your top seller crushed it again. The kitchen felt slammed. Cash should look good. Then you check the mix and see the item everyone pushed was carrying a thin margin and dragging ticket times.
That is why menu analysis starts with two numbers: contribution margin and popularity. NetSuite's menu engineering guide uses those two measures to sort items and support pricing, promotion, and removal decisions.
Start with contribution margin
Contribution margin answers a simple question. After you pay for the ingredients on the plate, how many dollars are left to cover labor, rent, utilities, and profit?
CM = Selling Price − Food Cost
Use dollars first. Percentages can hide bad decisions.
A dish with an acceptable food cost percentage can still be a weak item if the dollars left over are small, or if the plate ties up expensive labor for too little return. Owners miss this all the time with pasta, brunch plates, and loaded sandwiches. The menu price looks fine. The plate build says otherwise.
A practical rule is to review contribution margin item by item, not just by category. “Burgers” do not pay the bills. Specific burgers do.
Then measure popularity
Popularity is usually tracked by order count. If guests buy an item often, it earns attention. If they ignore it, high margin on paper does not help much.
But sales data is only half the picture now.
With digital and QR menus, operators can also see engagement before the order. Views, taps, dwell time, hovers, and drop-off points help explain why an item underperforms. If a high-margin dish gets plenty of menu views but few orders, the issue may be price, naming, or the photo. If it gets almost no views, the problem is placement or menu layout. That is a better read than waiting a full quarter to notice a “profitable” item nobody ever really considered.
During weekly manager review, check these together:
- Contribution margin in dollars
- Order count
- QR or digital menu views
- Where the item sits on the menu
- Whether servers mention it
- Whether it leads to add-ons
If you track a broader scorecard, this guide to restaurant KPIs worth tracking helps connect menu decisions to labor, traffic, and profit. If you want to increase Average Order Value, start here. Upsells work better when the base item already leaves enough dollars behind.
Why revenue sends owners in the wrong direction
Revenue rewards volume. Profit rewards discipline.
A high-revenue item can still be a bad use of menu space if it has low contribution, creates prep waste, or slows the line during peak periods. I have seen operators protect a “best seller” for months because it looked strong in top-line reports, even while it ate margin and jammed service.
Run this check in your next pre-shift or manager meeting. Pull the five top-selling items and the five highest contribution items. If the lists barely overlap, the menu is steering the business toward activity instead of profit.
That is the filter that matters. Keep the items that earn well and get ordered. Use digital engagement data to fix the ones guests notice but do not buy. Stop giving headline sales more credit than they deserve.
A Practical Step-by-Step Menu Analysis Framework
Friday dinner starts in 40 minutes. The line is stocked, servers are in pre-shift, and last week's “best seller” still looks strong on the POS report. Then you check the recipe cost and your QR menu data. Guests click it a lot, hover on it, ask about it, and then order something else. That is the kind of gap a useful menu analysis should catch before another busy weekend turns into thin profit.
Build a review process your managers can repeat every month without turning it into an office project.
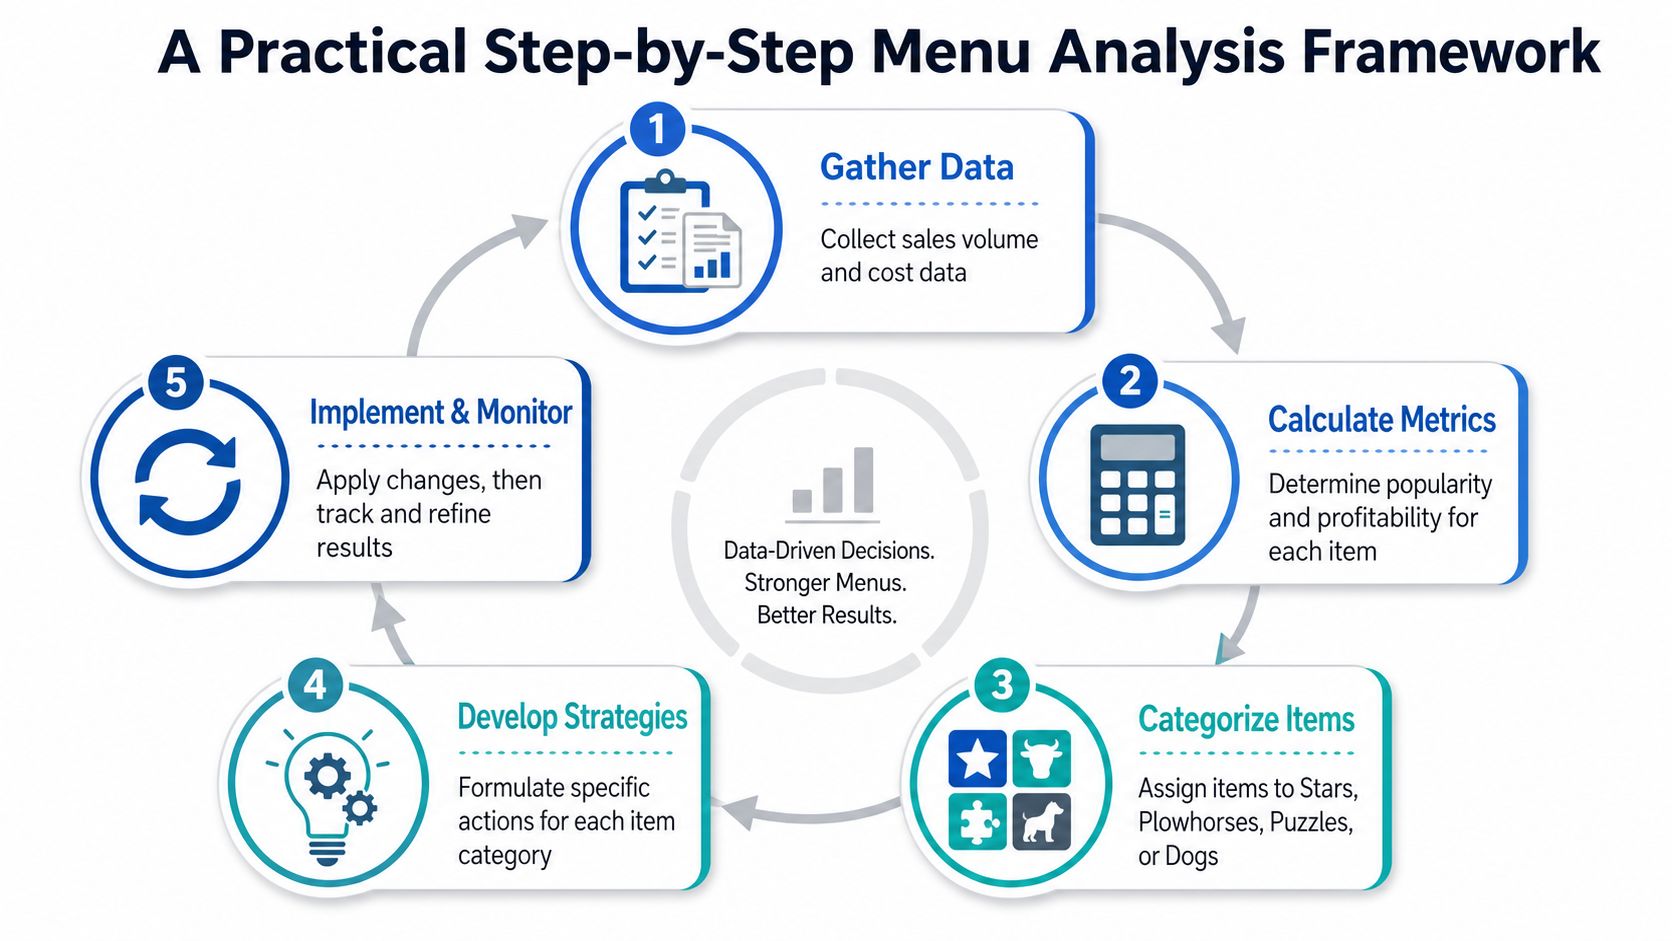
Step 1 and 2 get the inputs clean
1. Pull a useful sales window
Use enough history to smooth out weather swings, local events, staff changes, and one-off promos. Three months is a good working baseline for a full review. Less than that can push you into bad decisions based on noise.
If your business is seasonal, compare the same period last year too. A patio item in July and that same item in January are different businesses.
2. Rebuild plate costs from the recipe up
Weak analysis usually breaks at this point. If the cost card is wrong, every later decision is wrong too.
Use ingredient-level costing with as-prepared yields, not invoice price divided by portions. Trim loss, cooking loss, garnish, sauce resets, and portion creep belong in the number. The New Jersey menu analysis manual lays out the discipline well.
Keep these fields consistent:
- Unique item IDs
- Standard serving sizes
- Cooking method or prep description
- Current recipe specs
For operators tightening both pricing and placement, this guide to restaurant menu optimization shows how the analysis connects to actual menu changes.
A quick walkthrough can help your team visualize the flow:
Step 3 and 4 turn numbers into operating decisions
3. Calculate item performance
At the item level, measure contribution margin and popularity. Then add digital behavior if you run QR menus or online menus.
Look at:
- Orders sold
- Contribution margin per dish
- Menu views
- Hovers, taps, or expansions
- Conversion from view to order
- Add-ons attached to the item
This extra layer matters. An item with high views and low sales has a different problem from an item nobody notices. The first may need a better name, photo, price point, or server script. The second may need placement, bundling, or removal.
4. Classify the dish and assign one action
Every item needs a job. Keep the action simple enough that a manager can explain it in pre-shift.
- Stars. Protect position, hold quality, and train servers to keep selling them.
- Plowhorses. Improve margin through portion control, garnish cuts, or a small price move.
- Puzzles. Fix visibility and conversion. Use QR engagement data here first because guest interest already exists.
- Dogs. Challenge the item hard. If it is weak in sales, weak in margin, and weak in digital interest, it is taking up space.
Bring FOH and BOH into the same review. Servers hear objections. Cooks know which dishes slow the board, create waste, or rely on ingredients that hurt the rest of the menu.
Step 5 review, test, and keep score
Change one thing at a time and give it a fair test.
A workable rhythm looks like this:
- Choose a short list of problem items
- Make one change per item
- Brief the team before service
- Track sales and digital engagement
- Keep the winners and roll back the misses
Use phased cuts when you remove items. Guests can handle a tighter menu. They react badly when the menu changes so fast that the place feels unfamiliar.
One more rule from experience. Do not kill a dish just because sales are light for one month. Check whether the issue is demand, menu placement, pricing, description, or execution. If QR data shows guests keep viewing an item but not ordering it, the problem is often conversion, not awareness. That is a fixable problem, and it is exactly why modern menu analysis should combine sales data with engagement data before you make the final call.
Common Menu Analysis Pitfalls and How to Fix Them
Most bad menu analysis isn't caused by bad intent. It's caused by lazy assumptions.
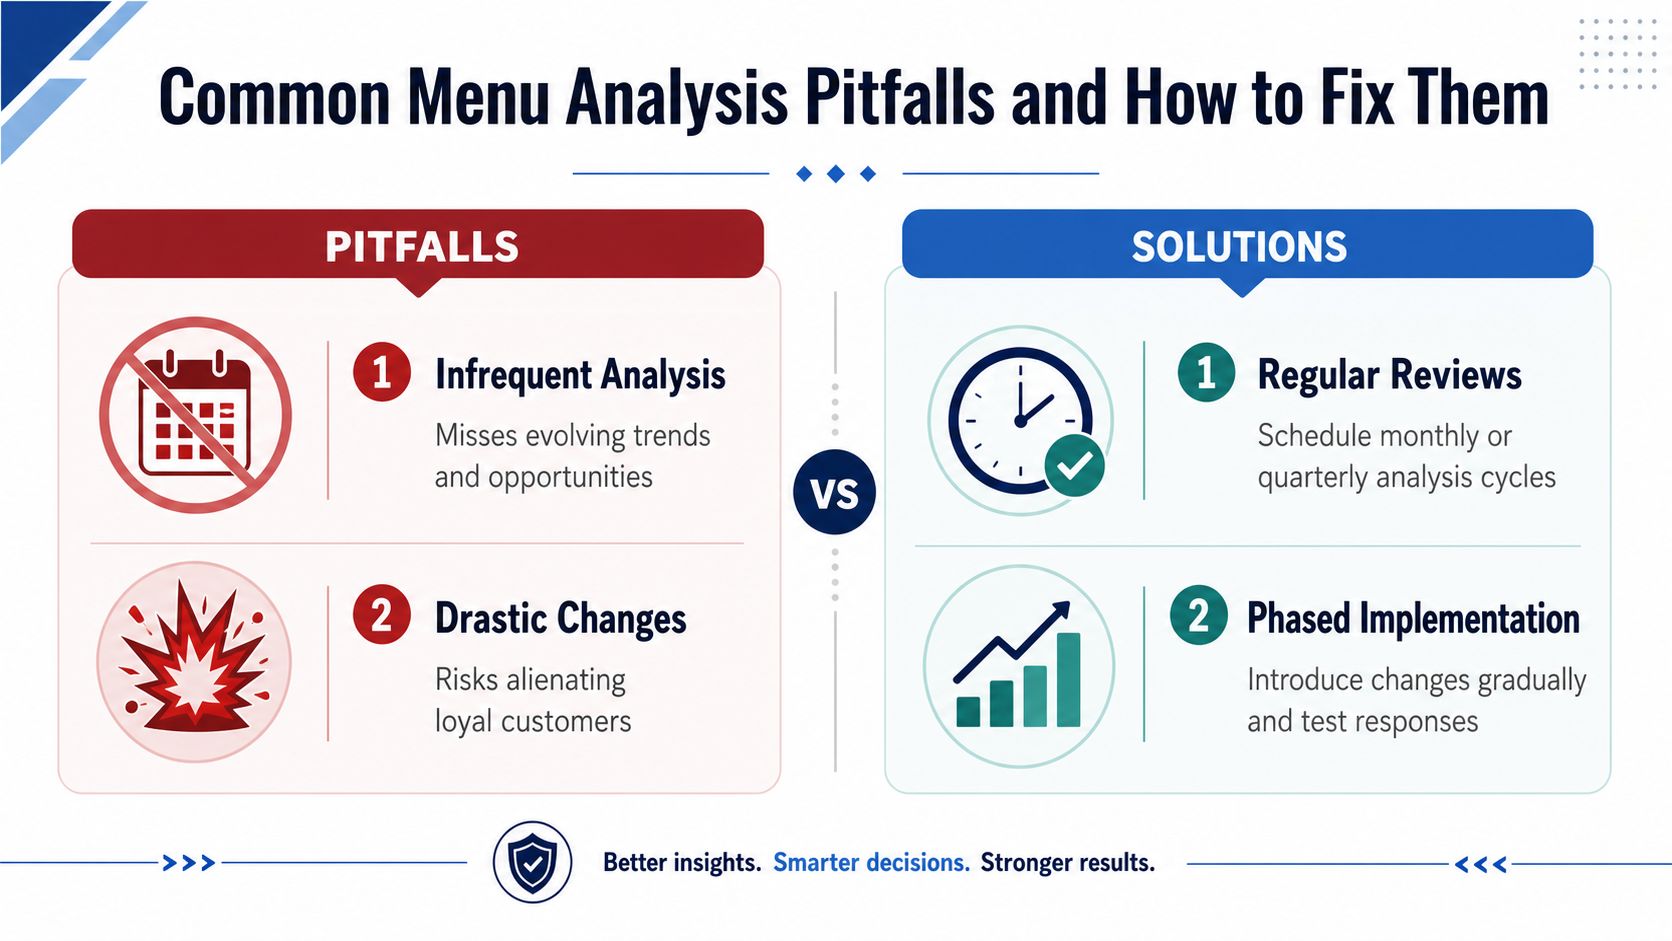
Operators often review too rarely, trust headline sales too much, or make aggressive changes after one report. Then they decide the process doesn't work, when execution was the problem.
Where operators go wrong
A few mistakes show up again and again.
Infrequent reviews
Menus drift. Costs move. guest behavior shifts. If you only look once in a long while, you're acting on old reality.Big menu cuts overnight
Guests don't like walking into a familiar restaurant and finding half the menu gone. Change needs pacing.Focusing on price instead of profit
Expensive dishes aren't automatically strong dishes.Ignoring design and positioning
A profitable item can underperform because it's buried, badly named, or hard to understand.
Don't remove a weak item before checking whether the problem is demand, visibility, or execution.
There's also a psychology layer many teams miss. Grouping items into value, mid-range, and premium choices, then placing the highest-margin item in the middle, can guide guests toward the better business choice through price anchoring, as described in Chef Ajay Chopra's guide to average order value and menu design.
Why QR menus changed the job
Traditional menu analysis mostly looked at what sold. That's no longer enough in digital ordering environments.
According to My Digi Menu's guide to menu analytics, many guides still rely on POS sales alone, even though digital menus generate 3–5x more behavioral signals per guest. That matters because now you can see more than orders. You can see what guests viewed, hovered on, considered, and skipped.
That changes the questions you should ask:
- Which item gets attention but no orders
- Which add-on is seen often but rarely selected
- Which section loses guests before conversion
- Which dishes attract interest but create hesitation
For operators using modern digital layouts, even presentation style matters. A concept such as a vanity restaurant menu may look polished, but if it hides profitable items or slows decision-making, it's not doing its job.
Old menu analysis asks, “What sold yesterday?” Better menu analysis asks, “What did guests consider, reject, and almost buy?” That's where modern profit opportunities sit.
From Analysis to Action with Smarter Menus
The value of menu analysis shows up when the guest experience changes in a profitable direction.
A Star should become easier to find. A Puzzle should get better visibility. A Plowhorse should carry a smarter add-on path. A Dog should stop stealing attention from stronger items. If the analysis doesn't change ordering behavior, it was just reporting.
Good analysis should change guest behavior
In print-menu thinking, the cycle often stops at review. In digital-menu thinking, the cycle keeps going.
A smarter menu can:
- Feature high-margin items where guests look
- Surface relevant add-ons at the right moment
- Reduce staff workload by handling routine upsell prompts digitally
- Give managers a cleaner read on what guests respond to
- Make menu testing faster across one site or many
The strongest menu isn't the one with the most items. It's the one that helps guests make profitable choices without friction.
Why execution is now digital
QR menus and modern ordering tools become practical, not merely trendy. They let operators turn insight into action quickly. A profitable but overlooked item can be repositioned fast. A high-volume low-margin item can be paired with better add-ons. A weak section can be simplified without waiting for a full reprint.
That operating mindset also fits a broader move toward using data to fuel smarter business growth instead of relying on instinct alone.
The core idea is simple. Menu analysis is not a one-off report. It's a repeatable operating habit. You review the item economics, watch guest behavior, make targeted changes, and keep refining.
If you want a simpler way to turn menu analysis into live action, RevMenue helps restaurants move beyond static menus with fast QR ordering, smarter upsells, and revenue-focused menu insights that are easier to use in real service.