
Most restaurants don't have a sales problem. They have a visibility problem.
The dining room feels busy. Staff are moving. Tickets keep printing. But something still feels off. Food waste looks higher than it should be. Labor feels heavy on some shifts and stretched on others. Guests are ordering, but the margin at the end of the week doesn't match the effort it took to get there.
I've seen this pattern over and over. Owners say, “We're doing decent revenue, so why does profit still feel tight?” The answer is usually simple. They're operating on instinct instead of tracking the few numbers that tell the truth.
A good KPI for a restaurant doesn't live in a spreadsheet for month-end reporting. It tells you what to fix today. It shows whether your menu is pulling its weight, whether your floor is paced properly, and whether your digital ordering setup is helping or subtly hurting margin.
Table of Contents
- Why Your Gut Feel Is Costing You Money
- What Is a Restaurant KPI and Why It Matters
- The Financial KPIs You Must Track
- The Operational KPIs Driving Daily Profit
- The Modern KPIs For Digital Menus and Ordering
- Your Playbook for Improving Key Metrics
- From Data Overload to Smart Decisions
Why Your Gut Feel Is Costing You Money
Friday night. The dining room is full, tickets are flying, and the bar is three deep. It feels like a strong service. Then you close the books and find weak margins, overtime you did not need, and online orders that grew sales while dragging down profit.
That gap is where operators lose money.
Gut feel is useful for reading the room. It is terrible for running the business. It notices that the place feels busy. It misses that your top-selling plate is underpriced, your best profit items are buried on the menu, and your second turn dies because tables sit dirty too long after payment.
Busy doesn't mean healthy. It often hides basic execution problems:
- Popular dishes with poor margin
- Staff schedules based on habit instead of hourly demand
- Slow table resets during peak periods
- Discounted digital orders that add volume but dilute profit
The fix is not more reporting for the sake of reporting. The fix is a short list of KPIs tied to daily action. If labor runs hot from 6 to 8 p.m., adjust the schedule. If table reset time slips, assign ownership and track it by shift. If online modifiers increase ticket size, feature them more aggressively in the ordering flow. A KPI only matters if it changes what your team does today.
The cost of guessing shows up fast. Food and labor are the two biggest controllable expenses in most restaurants. Small misses in either one can wipe out a good week. A manager who relies on instinct usually reacts after the damage is done. A manager who checks live sales mix, labor by hour, and order channel performance can correct the shift while service is still happening.
Modern tools make that practical. Your POS, kitchen display system, scheduling app, and online ordering platform already collect the signals. The mistake is leaving them in separate dashboards and reviewing them after the fact. Put the few numbers that matter in one daily view, review them before service, and tie each one to a clear action.
That is how you turn data into profit instead of trivia.
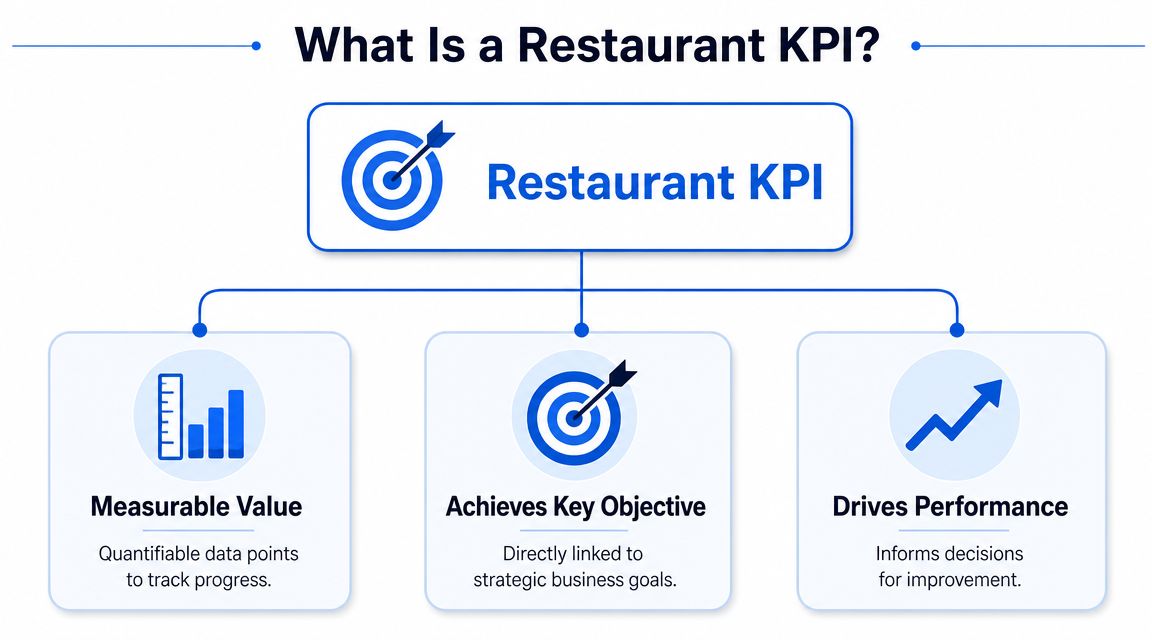
What Is a Restaurant KPI and Why It Matters
A KPI for a restaurant is a measurable number tied to a business outcome you care about.
Not a vanity metric. Not a report you glance at once a month. A KPI is a number that helps you decide what to do next.
Think of KPIs as business vital signs
If service feels slow, that's not a KPI.
If table turnover on Friday dinner is lagging, that is.
If guests “seem to spend less lately,” that's a feeling.
If average check size is dropping, that's something you can fix.
The point is clarity. KPIs turn loose observations into operational decisions.
The three KPI buckets that matter
Most operators make this harder than it needs to be. Keep it in three buckets.
- Financial KPIs track money health. These tell you whether sales are turning into actual profit.
- Operational KPIs track how efficiently the restaurant runs. These show whether your floor, kitchen, and service flow are helping or blocking revenue.
- Guest KPIs track demand quality. These tell you whether people are satisfied, returning, and spending in a healthy way.
Here's the simplest way to think about them:
| KPI bucket | What it answers | Typical examples |
|---|---|---|
| Financial | Are we making money properly | Sales, COGS, labor cost, prime cost, profit margin |
| Operational | Are we running efficiently | Table turnover, RevPASH, service pacing |
| Guest | Are people buying and coming back | Average check size, retention, satisfaction |
A restaurant that tracks only sales is driving with one eye closed.
A healthy business needs all three. You can hit revenue and still have weak margins. You can run a tight floor and still lose repeat visits. You can have happy guests and still underprice half the menu.
That's why good operators stop arguing about whether KPIs matter. They use them to remove guesswork. Once you know which bucket a problem belongs in, fixing it gets a lot easier.
The Financial KPIs You Must Track
Friday night feels packed. Tickets are flying, the dining room is full, and sales look strong. Then you check the week, and cash is tighter than it should be. That gap usually comes from weak control of a few financial KPIs, not from a sales problem.
Track these numbers hard. Review them weekly. Tie each one to an action your managers can take the same day.
Start with profit, not just sales
Sales matter, but sales alone can fool you.
A busy restaurant can still lose money through bad pricing, rising food cost, sloppy prep, overtime, and low-margin item mix. Profit margin tells you whether revenue is effectively turning into retained earnings. If margin is slipping, stop celebrating top-line growth and find out what is draining it.
Use sales and margin together. Sales shows volume. Margin shows quality of that volume.
COGS, labor, and prime cost
These are the financial KPIs that belong on every operator dashboard.
COGS
Cost of goods sold shows what it cost to produce the food and beverage you sold.
Simple working formula:
- COGS = Opening inventory + purchases – ending inventory
When COGS rises, the fix is rarely mysterious. Check portion sizes, waste logs, receiving accuracy, vendor invoices, and menu pricing. If your team still counts inventory on clipboards and fixes variances at month-end, you are reacting too late. A restaurant inventory manager app helps you catch usage problems while they are still fixable.
Labor cost
Labor cost shows what you spend to staff the business.
Simple working formula:
- Labor cost percentage = Total labor costs / total sales
This number gets mishandled all the time. Some owners cut hours too fast and wreck service. Others tolerate bloated schedules because the restaurant feels busy. Use actual sales by daypart, covers, and ordering patterns to write smarter schedules. Labor should follow demand, not habit.
Prime cost
Prime cost combines your two biggest controllable expenses.
Simple working formula:
- Prime cost = COGS + labor costs
This is the number I watch closest. If prime cost is drifting up, your operation is losing discipline somewhere in the kitchen, the schedule, or the menu. You do not need a long meeting to respond. You need tighter prep, cleaner purchasing, better staffing, and pricing that reflects your current costs.
What these numbers should trigger
A KPI is useful only if it leads to a clear move.
- Sales up, margin down means your mix is weak, discounts are too aggressive, or costs rose faster than pricing.
- COGS up means you need to inspect waste, portions, theft, transfers, or vendor increases.
- Labor up faster than sales means schedules are out of line with real demand.
- Prime cost up means food and labor are both pressuring profit, and both need intervention.
- Profit margin stuck means revenue growth is masking operating leaks.
Here is the standard I use with managers:
| KPI | What to ask immediately |
|---|---|
| Sales | Which categories, channels, and dayparts drove this |
| COGS | What changed in purchasing, waste, portions, or price |
| Labor cost | Which shifts, roles, or dayparts are overstaffed |
| Prime cost | Which cost moved first, food or labor |
| Profit margin | What are we keeping after all operating costs |
The point is simple. Financial KPIs should shape daily behavior. If COGS rises, ordering and portion checks happen that day. If labor drifts, the next schedule changes. If margin falls, menu pricing and product mix get reviewed before the problem turns into a bad month.
The Operational KPIs Driving Daily Profit
Friday dinner starts strong. By 7:15, the host stand is backed up, two four-tops are waiting on checks, and your best server is carrying a section that should have been flipped already. Sales look fine on paper, but the room is leaving money on the table in real time.
That is what operational KPIs are for. They connect daily service behavior to revenue you either capture or miss.
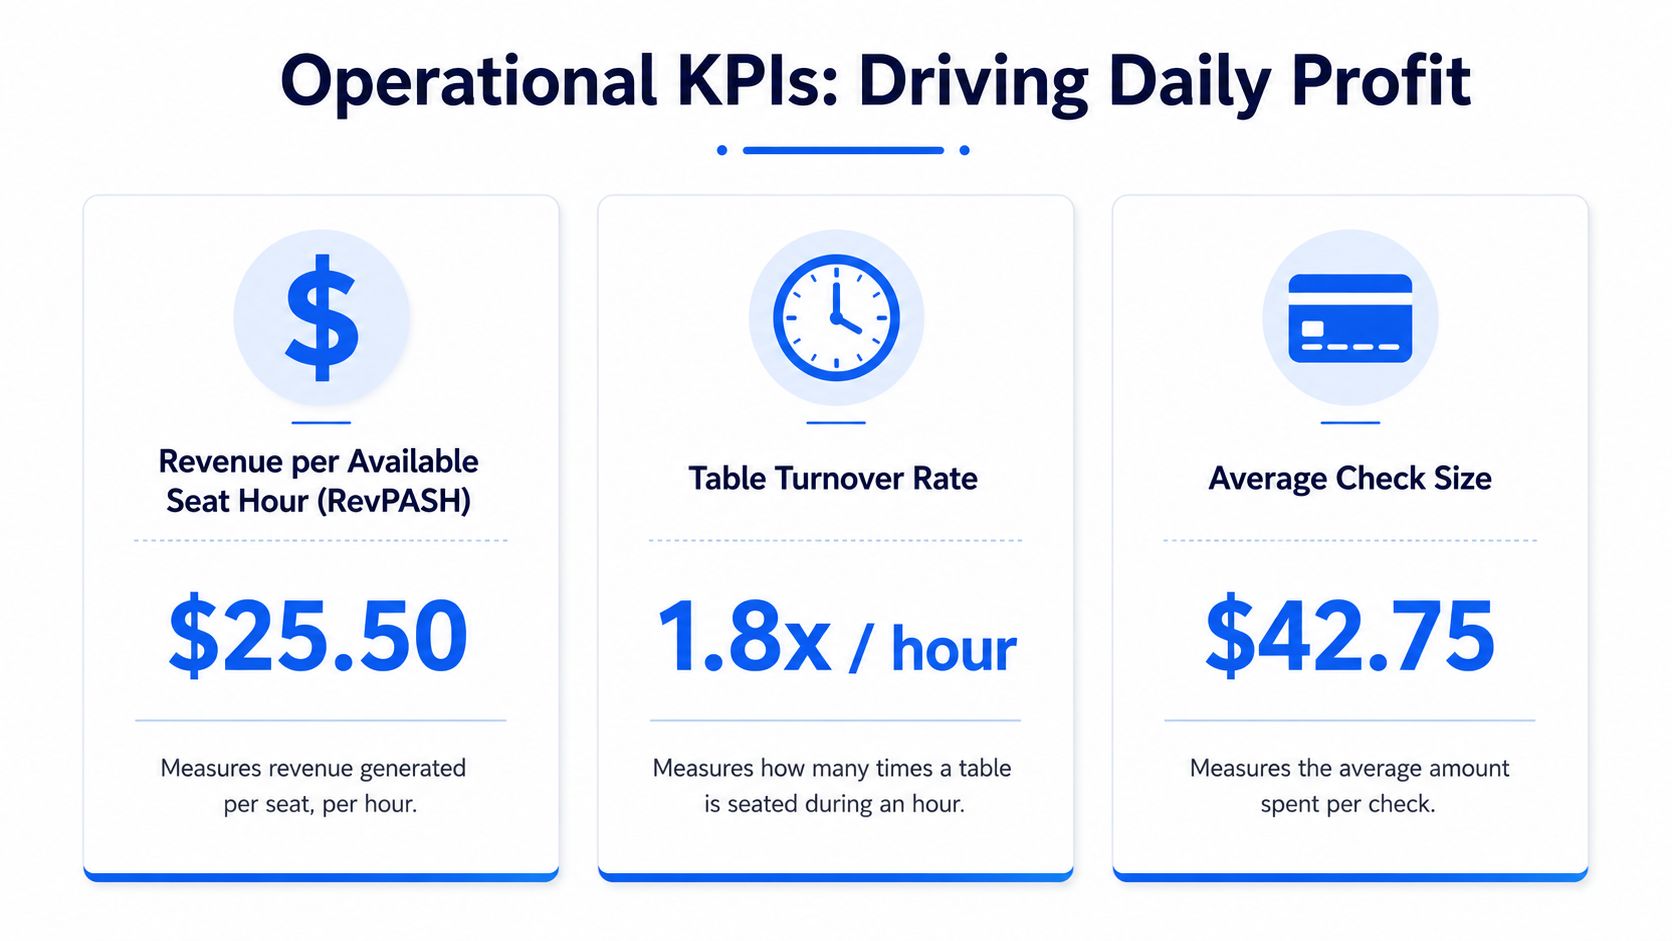
The floor metrics that change revenue fast
I watch three first. Average check size, table turnover rate, and RevPASH.
As noted earlier by Novatab, average check size = total sales divided by total transactions, and even a small lift matters. If average check moves from $24 to $26 across 1,000 transactions, that adds $2,000 in revenue. That is why this metric deserves daily attention. It responds to menu layout, server prompts, bundles, and digital add-ons faster than almost any other floor KPI.
Table turnover shows whether your dining room is producing. A full room does not guarantee strong revenue if tables sit too long between ordering, payment, and reset. Track turnover by daypart, not just by day. Lunch and dinner usually have different bottlenecks, and you fix them differently.
RevPASH gives you the cleanest read on how well you use seat capacity. SynergySuite notes that RevPASH = total revenue divided by available seats multiplied by opening hours, and that a common target for full-service restaurants is roughly $10 to $15 per seat-hour (SynergySuite on restaurant capacity metrics). Use that as a starting point, then compare against your own concept, check average, and service model.
Essential Restaurant KPIs at a Glance
| KPI | Formula | Good Benchmark (Varies by Type) |
|---|---|---|
| Average Check Size | Total Sales / Total Transactions | Improve against your own baseline |
| Table Turnover Rate | Number of Guests / Number of Tables | Depends on format and service model |
| RevPASH | Total Revenue / (Available Seats × Opening Hours) | Full-service guidance often cites roughly $10 to $15 per seat-hour |
| Customer Retention Rate | Track repeat guest behavior over time | Improve consistency, not just volume |
Operators who want these numbers to mean something need one system that ties service, sales, and stock together. An inventory manager app for restaurants helps you connect menu movement, prep usage, and sell-through before waste and outages distort the picture.
How to act on operational data
The mistake is treating these KPIs like scoreboard numbers. Use them as shift controls.
If table turnover is weak, inspect the gaps. Are guests waiting too long to order? Are entrees hitting the table in uneven waves? Are closed checks sitting for ten minutes before a reset? Fix the handoff, not the guest.
If average check stalls, change the selling process that day. Add one pairing prompt to pre-shift. Put high-margin add-ons where servers and digital ordering flows can surface them. Remove menu clutter that slows decisions and buries profitable items.
If RevPASH is soft during peak demand, you have a capacity problem disguised as a sales problem. Tighten reservation pacing, speed up payment, and staff support roles around turns, not just covers.
Use this standard with managers:
- Average check down. Review mix, add-on attachment, and server selling behavior.
- Turnover down. Check ticket times, payment delays, and table reset speed.
- RevPASH down. Look at seat occupancy, pacing, and dead time between parties.
- Retention softening. Make sure faster service is not turning into rushed service.
Good operators do not stare at these metrics at the end of the week. They check them during service, assign one fix, and watch the next shift for improvement. That is how daily profit gets built.
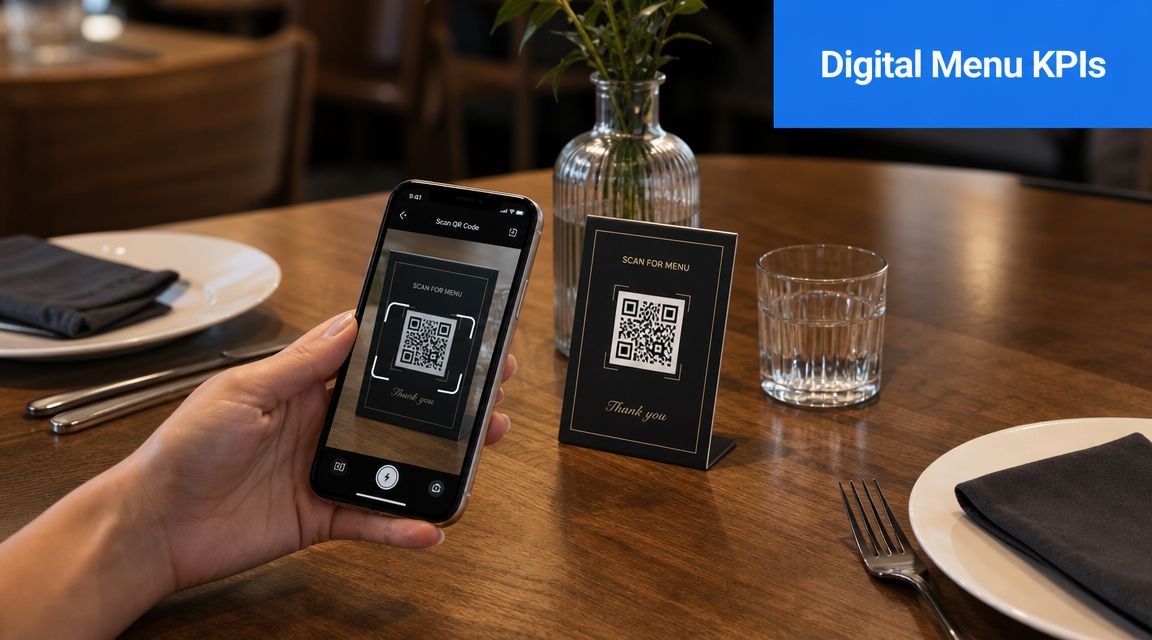
The Modern KPIs For Digital Menus and Ordering
Most KPI lists are stuck in the old model. They focus on food cost, labor, and sales, then stop.
That's not enough anymore. Once guests order through QR menus, kiosks, or mobile flows, the restaurant gains a new layer of measurable behavior. If you ignore it, you miss the levers that now shape revenue and workload.
Digital changes what you should measure
Jamezz makes the shift clear. Digital ordering changes the definition of restaurant KPIs by adding order-channel mix, digital conversion rate, attach rate for add-ons, digital orders vs. regular orders, product-connected upsell, basket upsell, menu item performance, and menu item efficiency as practical revenue metrics, not just nice-to-have analytics (Jamezz restaurant KPI guide).
That matters because a legacy metric can improve while the business gets worse.
Average check might rise because a digital channel pushes bundles aggressively. But if those bundles lean on discounting or low-margin items, your margin can weaken while the top-line number looks better. That's why channel-level measurement matters.
The digital KPIs worth watching
Here's what I'd track first in any digitally enabled venue:
- Order-channel mix tells you where demand is moving. Dine-in, QR, mobile pickup, and counter ordering don't behave the same way.
- Digital conversion rate shows whether menu browsing becomes actual orders.
- Attach rate for add-ons tells you if upsell prompts are working.
- Menu-item profitability by channel shows whether a winner on dine-in is still a winner on digital.
- Peak ordering time patterns reveal when digital demand helps or overloads the kitchen.
If you're using a digital menu QR code system, these are the numbers that separate a menu that merely displays items from one that helps you make better commercial decisions.
Why channel level menu data matters
A static menu can't tell you much beyond what sold. A digital menu can show how guests moved through choices before they bought.
That changes how you manage:
- You can spot weak add-on prompts instead of guessing why extras aren't moving.
- You can compare item performance by channel rather than treating all sales as equal.
- You can reduce staff workload by shifting routine ordering behavior to guest devices.
- You can test menu layout and placement based on observed customer behavior.
One practical example is menu psychology. If a profitable side rarely gets attached to a main, that may not be a product problem. It may be a presentation problem. The item could be buried, described poorly, or offered at the wrong step in the journey.
A quick walkthrough helps make this more concrete:
RevMenue is one option in this category. It's a revenue-focused menu platform that supports QR menus, menu updates, add-on prompts, and analytics around ordering behavior, which makes it relevant when you want digital metrics to connect back to revenue and efficiency rather than sit in a separate tool.
Your Playbook for Improving Key Metrics
Most KPI tracking fails for one reason. Teams collect numbers, talk about numbers, then go right back to the same habits.
Use a simple operating cycle instead.
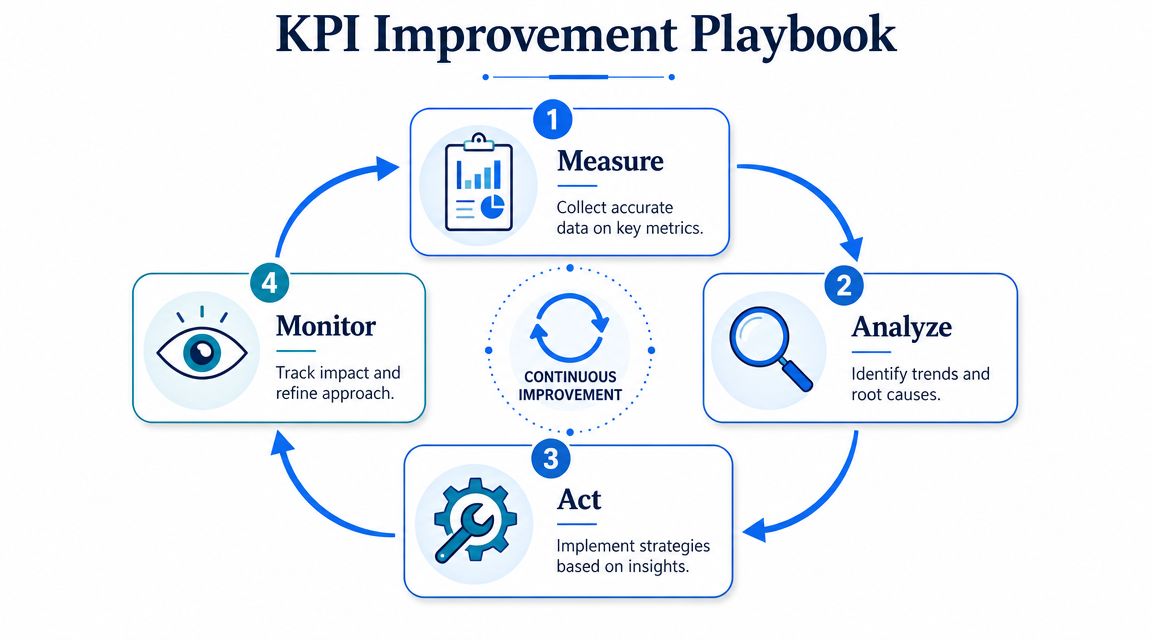
Measure without gaps
Pick a short list and track it consistently.
For most restaurants, that means:
- One financial KPI such as prime cost or COGS
- One floor KPI such as average check or table turnover
- One digital KPI if you use QR or mobile ordering
Don't build a huge dashboard on day one. You'll stop looking at it.
Track fewer numbers, but track them often enough that your team can still remember what caused the change.
Set one target that matters
A KPI without a target creates drift. But the target has to be practical.
Bad target: “Get labor down.”
Better target: “Bring labor into line on early weekday shifts by matching schedules to real demand.”
Bad target: “Sell more desserts.”
Better target: “Raise dessert attachment by improving placement and prompts at the end of the ordering flow.”
The target should answer one question. What behavior are we trying to change?
Act with small controlled changes
At this stage, operators either improve the business or waste everyone's time. Don't roll out five changes at once. Make one clear move, then watch the result.
Try actions like these:
To improve average check size
Add a bundle, a meal upgrade, or a well-timed side recommendation. On digital menus, place high-margin add-ons where the guest is already making a commitment.To improve table turnover
Focus on choke points. Ordering delays, kitchen pacing, payment lag, and table reset time matter more than telling staff to “move faster.”To improve COGS
Audit prep waste, check portions, and review low-margin items that sell well but don't contribute enough. Popularity is not the same as profitability.To improve labor efficiency
Rewrite the schedule around demand patterns, not manager habit. Tight opening shifts and sloppy shoulder periods are common labor leaks.To improve digital attach rate
Test wording, placement, and timing. “Add fries” behaves differently from a stronger bundled offer that feels useful rather than pushy.
Here's a practical way to assign accountability:
| KPI | Action owner | Example action |
|---|---|---|
| COGS | Kitchen lead | Portion check on top sellers |
| Labor cost | GM or shift manager | Rebuild weak schedules by daypart |
| Average check | FOH lead | Script pairings and menu prompts |
| Table turnover | Floor manager | Tighten payment and reset flow |
| Digital attach rate | Marketing or ops lead | Test add-on prompt sequence |
Review then repeat
Review after enough time has passed to see a pattern, not after one noisy shift.
Look for three things:
- Did the KPI move
- Did guest experience hold up
- Should we keep, tweak, or kill the change
Some ideas work fast. Others look clever and fail immediately. That's fine. The point of a KPI for a restaurant is to stop arguing from opinion.
A good review meeting should end with one decision, one owner, and one next action. Anything else is theatre.
From Data Overload to Smart Decisions
The goal isn't to track everything. The goal is to run a tighter, calmer, more profitable restaurant.
That starts when you stop treating KPIs like back-office admin and start using them as operating tools. Financial KPIs show whether the business is keeping money. Operational KPIs show whether the floor is converting capacity into revenue. Digital KPIs show how modern ordering behavior affects check size, margin, and workload.
If you're overwhelmed, don't build a giant dashboard. Pick one financial KPI and one operational KPI tied to your biggest pain point. Run that for the next month. If labor feels off, track labor properly. If service feels slow, track turnover and seat-hour productivity. If guests are scanning QR menus but not spending enough, focus on digital attach behavior.
The operators who improve fastest aren't the ones with the most data. They're the ones who turn a small amount of good data into consistent action.
If you want the measurement side to be easier, use software that pulls menu, ordering, and guest behavior into one place. A tool like restaurant analytics software can reduce manual tracking so your managers spend less time assembling reports and more time fixing what the numbers are telling them.
If you want a simpler way to connect menu performance, digital ordering, upsells, and guest behavior to actual revenue decisions, RevMenue is built for that job. It helps restaurants replace static menus with QR-based ordering and analytics so teams can spend less time guessing and more time improving the numbers that matter.