
Most restaurants already have the data. They just don't have a usable system for turning it into money.
You look at the daily sales report, see the top sellers, maybe check labor, maybe glance at discounts, then move on to service. Nothing changes. The same low-margin items stay on the menu. The same dead hours stay overstaffed. The same upsell opportunities get missed because nobody translated the numbers into a clear move.
That is the fundamental problem with restaurant data analytics. It is not lack of information. It is lack of action.
Used properly, restaurant data analytics is not a tech project. It's a margin tool. It helps you make better decisions on menu pricing, item placement, staffing, promos, and repeat business. It should lead to higher average checks, less waste, and fewer bad calls made on instinct alone.
Table of Contents
- Stop Guessing and Start Growing with Data
- The Only KPIs That Really Matter for Your Restaurant
- From Raw Data to Real Decisions
- Practical Examples of Data Analytics in Action
- Your Roadmap to Implementing Restaurant Analytics
- Choosing Your Tools and Protecting Customer Data
- How to Measure Your ROI and Final Takeaways
Stop Guessing and Start Growing with Data
A manager closes lunch, opens the POS report, and sees pages of numbers. Burgers sold well. A dessert barely moved. One server had stronger checks than the rest. Discounts jumped. Useful? Maybe. Actionable? Usually not.
That gap is where profit leaks out.
Restaurant data analytics matters because restaurants run on thin margins and high controllable costs. Prime cost, which combines food and labor, is widely treated as a core metric, with a common benchmark of about 55% to 65% of sales, and many operators target food cost around 28% to 35% and labor around 25% to 35% depending on format, according to restaurant margin benchmarks from MOST. A few points of improvement in pricing, scheduling, or waste control can change the whole picture.

The operators who win don't stare at reports longer. They use a small set of numbers to make same-day decisions.
Practical rule: If a report doesn't tell your team what to change before the next shift, it's not helping enough.
Good restaurant data analytics answers practical questions fast:
- What should stay on the menu because it sells and protects margin
- What should be repositioned because it's popular but underpriced
- When to add or cut labor based on actual demand patterns
- Which channels distort performance such as dine-in versus delivery
- Where upsells belong so guests spend more without staff forcing it
This is why analytics shouldn't live in finance alone. It belongs in pre-shift, in menu reviews, in promotions, and in the hands of the people making floor decisions.
The Only KPIs That Really Matter for Your Restaurant
Friday dinner is slammed. Sales look strong. Then you check discounts, labor by hour, and item margin. The night was busy, but not very profitable.
That's why a short KPI list beats a bloated dashboard every time. You need numbers that lead to action before the next shift, not a pile of reports nobody uses.
Watch the metrics that change tomorrow's decisions
Start with the metrics tied directly to menu moves, staffing corrections, and pricing. If a KPI does not help you cut waste, raise check average, or schedule labor better, it does not deserve daily attention.
Here's the shortlist:
- Sales per labor hour: Shows whether each shift is staffed to demand or carrying dead weight.
- Average transaction value: Tells you if bundles, add-ons, and menu prompts are lifting checks.
- Item-level gross profit: Shows which dishes contribute cash after food cost.
- Sales mix: Reveals what guests choose most often, which matters only if margin backs it up.
- Discount rate: Exposes fake growth caused by over-discounting.
- Channel mix: Separates healthy dine-in revenue from delivery sales that look good but erode margin.
- Repeat visit behavior: Helps you spot whether guests are returning or just trying you once.
If you want those numbers in one place without chasing spreadsheets, use restaurant KPI software for real-time performance.
Use sales data to fix the menu
A menu should earn its space.
Plenty of restaurants keep high-volume items that clog the line, slow tickets, and deliver weak margin. That is a management mistake, not a menu strategy. Sales data should be used to fix the menu fast.
Track these menu-focused KPIs closely:
- Item-level gross profit: Keep, push, or feature dishes that sell and pay.
- Sales mix: Spot favorites, but do not confuse popularity with value.
- Discount tracking: Find items or dayparts where you are buying sales.
- Average transaction value: Measure whether prompts, combos, and suggested add-ons are working.
- Channel mix by item: Some dishes travel well and keep margin. Others should stay dine-in only.
Checkmate's breakdown of restaurant analytics metrics highlights daily sales, average transaction value, popular dish ranking, discount tracking, item-level gross profit, peak-hour performance, and channel mix as useful restaurant analytics metrics.
Here's the practical rule. If an item sells well but leaves weak gross profit, reprice it, reduce portion cost, change the placement on your menu, or replace it. If a high-margin item sells poorly, feature it better. Put it in a bundle. Add a photo on your QR menu. Test a sharper name or description. Last-mile action matters more than the report.
Keep guest and labor KPIs simple enough to use
Restaurant teams do not need twenty KPIs. They need a handful they can review in pre-shift, in weekly manager meetings, and during menu updates.
| Question | KPI to watch | What to do with it |
|---|---|---|
| Are guests spending enough? | Average transaction value | Add bundles, upsells, and better menu prompts |
| Is staffing efficient? | Sales per labor hour | Cut slow-hour coverage or shift stronger staff into peak periods |
| Is the menu worth carrying? | Sales mix plus item-level gross profit | Reprice, reposition, feature, or remove weak items |
| Are promos helping? | Discount rate | Tighten offer rules and stop broad discounts that drain margin |
| Are channels performing equally? | Channel mix | Adjust pricing, packaging, and menu availability by channel |
| Are guests returning? | Repeat visit behavior | Improve retention offers and fix experience gaps before spending more on acquisition |
Review these consistently. Act on them quickly. That's it.
From Raw Data to Real Decisions
Friday dinner is packed, but profit remains soft. The dining room feels busy, labor costs run high, and the kitchen burns through product faster than expected. If your reporting ends at sales totals, you miss the core question. What needs to change before the next shift starts?
Raw data records activity. Useful analytics turns that activity into a decision.
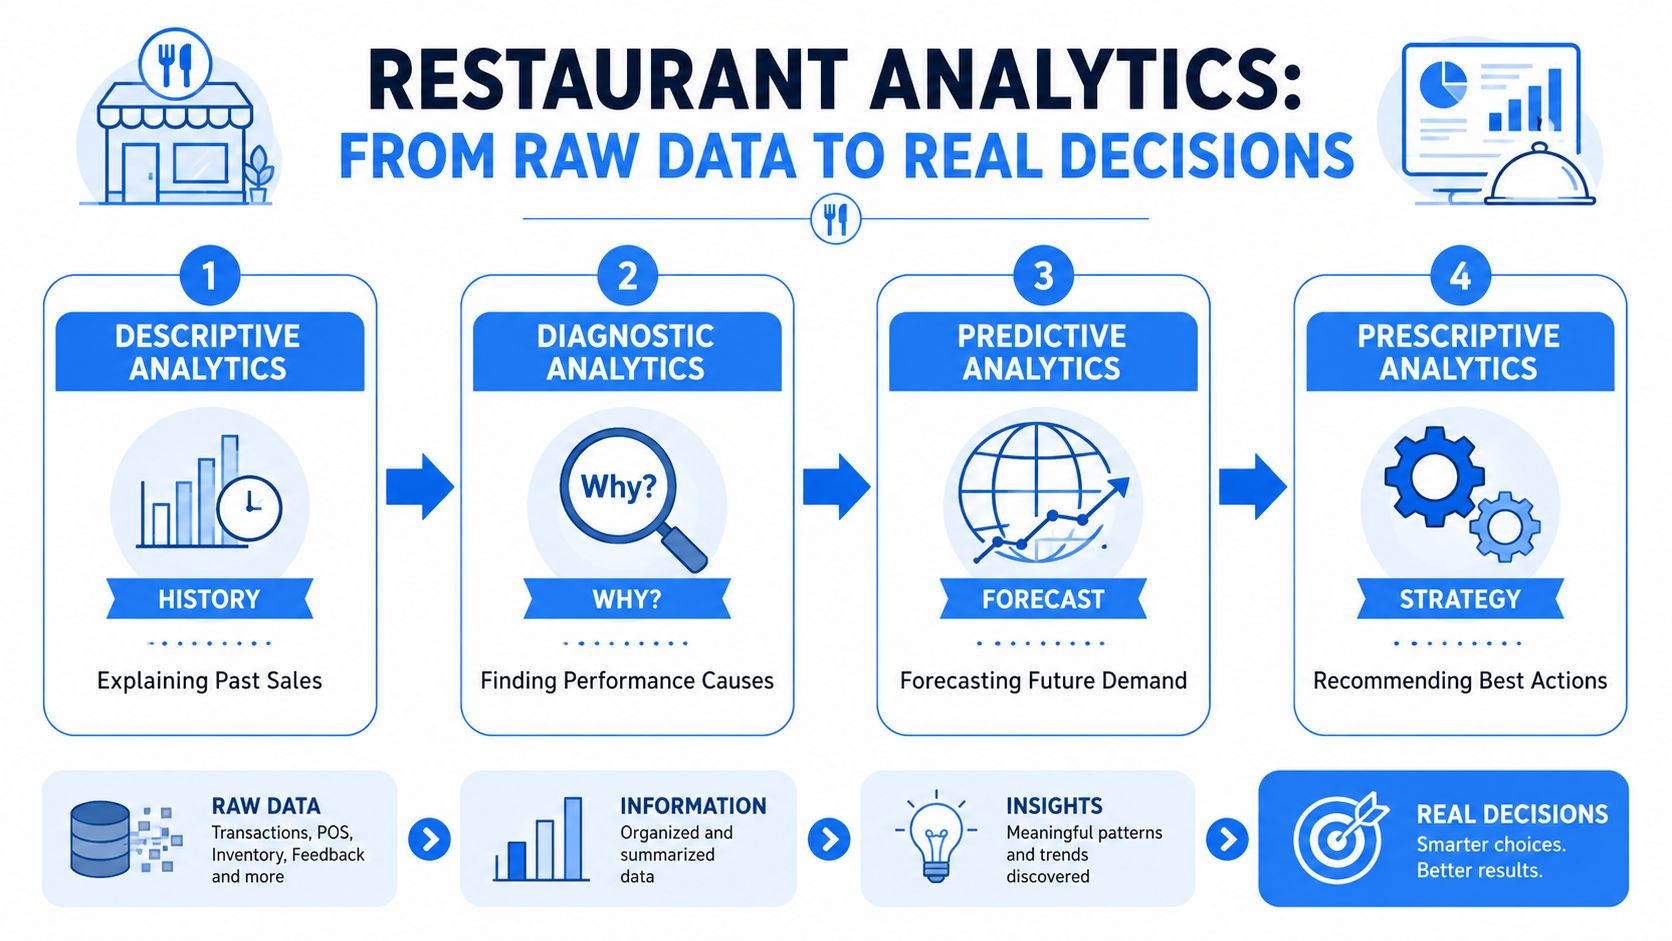
Restaurant operators already have plenty of inputs. POS tickets, labor hours, inventory movement, reservations, guest feedback, delivery mix, discount usage. The problem is not access. The problem is translation. Good analytics narrows the noise, finds the cause, and points to the next move you should make on menu, staffing, pricing, or promotion.
Descriptive means what happened
Descriptive analytics is the rearview mirror.
It shows the facts. Pasta sold well on Friday. Tuesday discounts spiked. Lunch traffic sagged. Every restaurant needs that baseline, but reporting alone does not improve margin. It just confirms that something happened.
Use descriptive data to spot patterns fast. Then move immediately to the operational question behind the pattern.
Diagnostic means why it happened
Diagnostic analytics connects the dots.
Maybe pasta moved because it was placed higher on the menu. Maybe the discount spike came from staff overusing a promo button. Maybe lunch looked weak in the dining room because orders shifted to delivery, where packaging and commission cut deeper into margin.
Ask questions that lead to action:
- Did sales change because of price, placement, or promotion?
- Did labor run high because the forecast missed or because the schedule stayed bloated after demand softened?
- Did food cost rise because of mix, waste, or portion inconsistency?
- Did a fast-growing channel bring in revenue but drag down profit?
That last question matters more than operators admit. A sales increase that comes through the wrong channel can leave you busier and poorer.
Predictive and prescriptive mean what to do next
Predictive analytics estimates what is likely to happen on the next shift, next day, or next week. Use it to tighten prep, ordering, and staffing before waste shows up on the P&L.
Prescriptive analytics recommends the response. Cut one server from a slow mid-afternoon block. Push a high-margin entree on your QR menu during peak dinner hours. Pull back a discount that drives volume without contribution. Raise the price on a resilient item and watch mix, not just top-line sales.
That is the standard. Analytics should end in an operational change.
For menu decisions, speed matters. A printed menu slows down testing. A digital menu lets you change placement, naming, photos, and pricing quickly, then track whether guest behavior improves. If you want a practical framework for that process, review this guide to restaurant menu optimization.
The goal is simple. Make better calls before service starts, while there is still time to protect margin.
Practical Examples of Data Analytics in Action
Saturday dinner starts in 20 minutes. One entrée sells all night but barely clears margin. Two servers are scheduled for a lull that never turns into sales. Guests keep ordering sandwiches without the drink or side that should have lifted the check. Those are not reporting problems. They are profit problems, and they need action before the next shift.
Scenario one menu engineering that changes what guests buy
A full-service restaurant reviews POS data and finds a common mistake hiding behind decent sales. One dish is popular, but after food cost, prep time, and discounting, it contributes less profit than management assumed. Another item sells less often and puts more dollars on the plate.
Act on that immediately.
The team should:
- Move the higher-margin item to a stronger menu position
- Rewrite the description to sell the outcome, not just the ingredients
- Raise the weak item's price if guests keep buying it with little resistance
- Build a bundle with a side or drink to raise contribution per order
That's basic menu engineering. The problem is speed. Printed menus slow down testing, while digital menus let you adjust placement, naming, photos, and pricing quickly, then watch what happens to mix and check average. If you want a practical process for that, use this guide to restaurant menu optimization.
Scenario two labor fixes based on actual demand
Now look at a café that feels understaffed during rushes and bloated during slow periods. The schedule was built from memory, habit, and whoever complained last week.
A simple comparison of transaction timing against labor hours usually exposes the problem fast. You can see when the rush starts, how long it lasts, and which menu items slow production enough to justify extra coverage. Then you make the boring changes that save money.
- trim an opening hour that rarely pays for itself
- stagger breaks before the rush instead of during it
- put the fastest cashier or expo in place before volume hits
- stop repeating the same schedule just because it is familiar
None of that is glamorous. All of it protects margin.
Here's a solid walkthrough of the mindset in practice:
Scenario three QR menus that turn insight into instant action
Operators miss this opportunity every day. They spot a clear pattern, then wait weeks to do anything with it.
Suppose guests consistently order a burger without a side or beverage. You already know the solution. The actual question is how quickly you can present that solution to the guest. Staff reminders fade. Table tents get ignored. Printed menus remain unchanged until the next reprint.
A QR menu gives you a faster path. Add prompts like “make it a combo,” “add bacon,” or “pair with a house drink” and measure the result by average check and attachment rate. Keep the winner. Cut the loser. Then test the next offer.
The shortest path from data to margin is often a menu edit, not a management meeting.
That is last-mile actionability. You spot the pattern, change the menu the same day, and measure whether guests buy differently. Analytics should work like that. Fast, visible, and tied to profit.
Your Roadmap to Implementing Restaurant Analytics
Most restaurants don't need a giant rollout. They need a clean start.
The biggest mistake is buying more software before fixing basic reporting habits. If your item names are inconsistent, discounts are messy, or no one reviews shift-level data, a new dashboard won't save you.
A more practical issue sits underneath all of this. Most restaurant analytics advice explains dashboards and forecasting, but it often stops before showing how to turn insight into immediate menu or revenue changes. That last-mile actionability gap is a real problem, as described in this restaurant analytics guide from Restolabs.
Step one clean up the data you already own
Start with your POS. It already holds the sales, timing, item, and discount data that should drive daily decisions.
Check these first:
- Item names: Clean them up so the same dish isn't split across multiple labels.
- Modifiers: Standardize add-ons so you can track real attachment behavior.
- Discount buttons: Remove old or vague promo options that muddy reporting.
- Dayparts: Define them clearly so lunch and dinner comparisons mean something.
If your base data is sloppy, every conclusion after that is suspect.
Step two connect the systems that shape the shift
Once the POS is reliable, connect the systems that affect margin and service.
That usually means:
- Labor and scheduling
- Inventory
- Reservations
- Online ordering
- Delivery channels
- Guest feedback
You don't need perfect integration across everything on day one. You need enough visibility to connect sales, staffing, and item performance. That's where the useful decisions sit.
Step three choose tools that lead to action
Operators often get seduced by nice charts.
Don't buy a platform because it looks polished. Buy one if it helps managers do something faster and better. Better menu edits. Better staffing changes. Better price decisions. Better upsell deployment.
A simple test works well:
| Tool question | Good answer | Bad answer |
|---|---|---|
| Does it show data in real time? | Managers can act during service or before the next shift | Reports arrive too late |
| Can it connect channels? | Dine-in, delivery, and digital ordering are visible separately | Everything is blended together |
| Does it support action? | You can update menus, promos, or workflows fast | It just produces more dashboards |
If the tool can't shorten the distance between insight and action, skip it.
Choosing Your Tools and Protecting Customer Data
Friday night exposes bad software fast. The host stand is backed up, delivery tickets are stacking, labor is running hot, and your manager is clicking through three systems just to answer one basic question: which sales channel is making money tonight?
That is the standard for tool selection. Pick systems that help the team make faster shift-level decisions on menu availability, pricing, staffing, and promotions. If a platform gives you charts but slows down action, it is overhead.
Pick tools based on operating reality
Start with the decision you need to improve.
If you run one location and mainly need tighter reporting on sales mix, discounts, voids, and item performance, built-in POS reporting may be enough. If your real problem is disconnected ordering, reservations, labor, and guest data, an all-in-one platform can reduce friction. If one profit lever matters more than the rest, such as menu engineering, digital ordering behavior, or guest retention, use a specialist tool and expect more control.
Use a simple filter:
- Choose POS-native reporting if managers need faster visibility into daily performance.
- Choose broader software if teams are wasting time stitching together channel, labor, and sales data.
- Choose specialist software if you need sharper action in one area with direct margin impact.
Be strict here. The right tool should help you change something by the next shift. That might mean pulling a low-margin item from a QR menu, raising the price of a high-demand modifier, pausing a weak promo, or adjusting staffing after seeing channel mix shift toward delivery. If you are evaluating platforms built for that kind of last-mile execution, review analytics software for restaurants that ties guest behavior to menu and revenue decisions.
Treat privacy like part of operations
Customer data can improve repeat visits and offer relevance. It can also create legal risk and erode trust if you collect too much or handle it poorly.
Keep the rules simple and enforceable:
- Ask clearly: Tell guests what you collect and what they get in return.
- Get consent properly: Especially for SMS, email, and loyalty marketing.
- Collect less: If the team will not use the data, do not store it.
- Make opt-outs easy: Guests should be able to leave your list without friction.
- Check vendor controls: Your tools should support consent records, user permissions, and basic access controls.
Good privacy practice also improves data quality. You get cleaner customer lists, better campaign targeting, and fewer fake signups from staff chasing quota.
Guests will share useful information when the value is obvious and the experience feels respectful.
Handle customer data with the same discipline you expect in cash handling and food safety. Sloppy habits cost money here too.
How to Measure Your ROI and Final Takeaways
You don't measure restaurant data analytics by how many dashboards you installed. You measure it by what changed in the operation.
Measure operational changes not dashboard activity
Look for movement in the business areas your team touched:
- Average transaction value after you added bundles, prompts, or upsells
- Food cost performance after menu edits, tighter purchasing, or reduced waste
- Labor efficiency after rebuilding schedules around actual demand
- Repeat guest behavior after improving follow-up and relevance
- Promo quality after cutting weak discounts and backing stronger offers
The point is simple. Tie every analytics effort to one operating decision and one business outcome. If the action is vague, the result will be vague too.
What to do next
Keep it tight.
- Pick one problem first: weak check averages, poor labor alignment, or menu clutter
- Use a short KPI list: don't flood managers with noise
- Review data frequently: daily for operations, weekly for menu and promo decisions
- Act fast on menu insights: especially in digital and QR environments
- Keep testing: pricing, placement, bundles, and prompts all deserve iteration
Restaurant data analytics works when it becomes part of service, not just part of reporting. The operators who use it well aren't more technical. They're more disciplined about turning numbers into decisions.
If you want a faster path from menu data to practical revenue moves, RevMenue is built for that last-mile actionability. It helps restaurants turn QR menu traffic, ordering behavior, and real-time insights into immediate menu changes, smarter upsells, and better margin decisions without ripping out the systems they already use.